

2011 National Survey of Fishing, Hunting, and ... - Census Bureau
2011 National Survey of Fishing, Hunting, and ... - Census Bureau
2011 National Survey of Fishing, Hunting, and ... - Census Bureau

You also want an ePaper? Increase the reach of your titles
YUMPU automatically turns print PDFs into web optimized ePapers that Google loves.
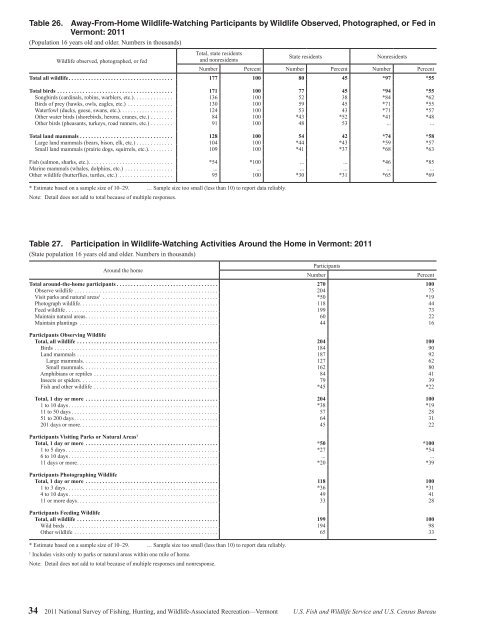
Table 26. Away-From-Home Wildlife-Watching Participants by Wildlife Observed, Photographed, or Fed in<br />
Vermont: <strong>2011</strong><br />
(Population 16 years old <strong>and</strong> older. Numbers in thous<strong>and</strong>s)<br />
Wildlife observed, photographed, or fed<br />
Total, state residents<br />
<strong>and</strong> nonresidents<br />
State residents<br />
Nonresidents<br />
Number Percent Number Percent Number Percent<br />
Total all wildlife ..................................... 177 100 80 45 *97 *55<br />
Total birds ......................................... 171 100 77 45 *94 *55<br />
Songbirds (cardinals, robins, warblers, etc.) .............. 136 100 52 38 *84 *62<br />
Birds <strong>of</strong> prey (hawks, owls, eagles, etc.) ................ 130 100 59 45 *71 *55<br />
Waterfowl (ducks, geese, swans, etc.). . . . . . . . . . . . . . . . . . . 124 100 53 43 *71 *57<br />
Other water birds (shorebirds, herons, cranes, etc.) ........ 84 100 *43 *52 *41 *48<br />
Other birds (pheasants, turkeys, road runners, etc.) ........ 91 100 48 53 ... ...<br />
Total l<strong>and</strong> mammals ................................. 128 100 54 42 *74 *58<br />
Large l<strong>and</strong> mammals (bears, bison, elk, etc.) ............. 104 100 *44 *43 *59 *57<br />
Small l<strong>and</strong> mammals (prairie dogs, squirrels, etc.) ......... 109 100 *41 *37 *68 *63<br />
Fish (salmon, sharks, etc.) .............................. *54 *100 ... ... *46 *85<br />
Marine mammals (whales, dolphins, etc.) ................. ... ... ... ... ... ...<br />
Other wildlife (butterflies, turtles, etc.) ................... 95 100 *30 *31 *65 *69<br />
* Estimate based on a sample size <strong>of</strong> 10–29. … Sample size too small (less than 10) to report data reliably.<br />
Note: Detail does not add to total because <strong>of</strong> multiple responses.<br />
Table 27. Participation in Wildlife-Watching Activities Around the Home in Vermont: <strong>2011</strong><br />
(State population 16 years old <strong>and</strong> older. Numbers in thous<strong>and</strong>s)<br />
Around the home<br />
Participants<br />
Total around-the-home participants .................................... 270 100<br />
Observe wildlife ................................................... 204 75<br />
Visit parks <strong>and</strong> natural areas 1 ......................................... *50 *19<br />
Photograph wildlife ................................................. 118 44<br />
Feed wildlife ...................................................... 199 73<br />
Maintain natural areas ............................................... 60 22<br />
Maintain plantings ................................................. 44 16<br />
Participants Observing Wildlife<br />
Total, all wildlife .................................................. 204 100<br />
Birds .......................................................... 184 90<br />
L<strong>and</strong> mammals .................................................. 187 92<br />
Large mammals ................................................ 127 62<br />
Small mammals ................................................ 162 80<br />
Amphibians or reptiles ............................................ 84 41<br />
Insects or spiders ................................................. 79 39<br />
Fish <strong>and</strong> other wildlife ............................................ *45 *22<br />
Total, 1 day or more ............................................... 204 100<br />
1 to 10 days ..................................................... *38 *19<br />
11 to 50 days .................................................... 57 28<br />
51 to 200 days ................................................... 64 31<br />
201 days or more ................................................. 45 22<br />
Participants Visiting Parks or Natural Areas 1<br />
Total, 1 day or more ............................................... *50 *100<br />
1 to 5 days ...................................................... *27 *54<br />
6 to 10 days ..................................................... ... ...<br />
11 days or more .................................................. *20 *39<br />
Participants Photographing Wildlife<br />
Total, 1 day or more ............................................... 118 100<br />
1 to 3 days ...................................................... *36 *31<br />
4 to 10 days ..................................................... 49 41<br />
11 or more days .................................................. 33 28<br />
Participants Feeding Wildlife<br />
Total, all wildlife .................................................. 199 100<br />
Wild birds ...................................................... 194 98<br />
Other wildlife ................................................... 65 33<br />
* Estimate based on a sample size <strong>of</strong> 10–29. … Sample size too small (less than 10) to report data reliably.<br />
1<br />
Includes visits only to parks or natural areas within one mile <strong>of</strong> home.<br />
Note: Detail does not add to total because <strong>of</strong> multiple responses <strong>and</strong> nonresponse.<br />
Number<br />
Percent<br />
34 <strong>2011</strong> <strong>National</strong> <strong>Survey</strong> <strong>of</strong> <strong>Fishing</strong>, <strong>Hunting</strong>, <strong>and</strong> Wildlife-Associated Recreation—Vermont U.S. Fish <strong>and</strong> Wildlife Service <strong>and</strong> U.S. <strong>Census</strong> <strong>Bureau</strong>


