

2011 National Survey of Fishing, Hunting, and ... - Census Bureau
2011 National Survey of Fishing, Hunting, and ... - Census Bureau
2011 National Survey of Fishing, Hunting, and ... - Census Bureau

You also want an ePaper? Increase the reach of your titles
YUMPU automatically turns print PDFs into web optimized ePapers that Google loves.
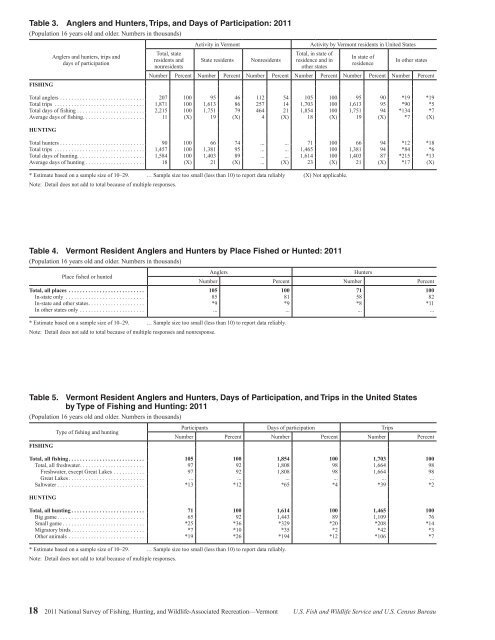
Table 3. Anglers <strong>and</strong> Hunters, Trips, <strong>and</strong> Days <strong>of</strong> Participation: <strong>2011</strong><br />
(Population 16 years old <strong>and</strong> older. Numbers in thous<strong>and</strong>s)<br />
FISHING<br />
Anglers <strong>and</strong> hunters, trips <strong>and</strong><br />
days <strong>of</strong> participation<br />
Total, state<br />
residents <strong>and</strong><br />
nonresidents<br />
Activity in Vermont<br />
State residents<br />
Nonresidents<br />
Activity by Vermont residents in United States<br />
Total, in state <strong>of</strong><br />
residence <strong>and</strong> in<br />
other states<br />
In state <strong>of</strong><br />
residence<br />
In other states<br />
Number Percent Number Percent Number Percent Number Percent Number Percent Number Percent<br />
Total anglers .............................. 207 100 95 46 112 54 105 100 95 90 *19 *19<br />
Total trips ................................ 1,871 100 1,613 86 257 14 1,703 100 1,613 95 *90 *5<br />
Total days <strong>of</strong> fishing ........................ 2,215 100 1,751 79 464 21 1,854 100 1,751 94 *134 *7<br />
Average days <strong>of</strong> fishing. . . . . . . . . . . . . . . . . . . . . . 11 (X) 19 (X) 4 (X) 18 (X) 19 (X) *7 (X)<br />
HUNTING<br />
Total hunters .............................. 90 100 66 74 ... ... 71 100 66 94 *12 *18<br />
Total trips ................................ 1,457 100 1,381 95 ... ... 1,465 100 1,381 94 *84 *6<br />
Total days <strong>of</strong> hunting. . . . . . . . . . . . . . . . . . . . . . . . 1,584 100 1,403 89 ... ... 1,614 100 1,403 87 *215 *13<br />
Average days <strong>of</strong> hunting ..................... 18 (X) 21 (X) ... (X) 23 (X) 21 (X) *17 (X)<br />
* Estimate based on a sample size <strong>of</strong> 10–29. … Sample size too small (less than 10) to report data reliably (X) Not applicable.<br />
Note: Detail does not add to total because <strong>of</strong> multiple responses.<br />
Table 4. Vermont Resident Anglers <strong>and</strong> Hunters by Place Fished or Hunted: <strong>2011</strong><br />
(Population 16 years old <strong>and</strong> older. Numbers in thous<strong>and</strong>s)<br />
Place fished or hunted<br />
Anglers<br />
Hunters<br />
Number Percent Number Percent<br />
Total, all places ........................... 105 100 71 100<br />
In-state only ............................ 85 81 58 82<br />
In-state <strong>and</strong> other states .................... *9 *9 *8 *11<br />
In other states only ....................... ... ... ... ...<br />
* Estimate based on a sample size <strong>of</strong> 10–29. … Sample size too small (less than 10) to report data reliably.<br />
Note: Detail does not add to total because <strong>of</strong> multiple responses <strong>and</strong> nonresponse.<br />
Table 5. Vermont Resident Anglers <strong>and</strong> Hunters, Days <strong>of</strong> Participation, <strong>and</strong> Trips in the United States<br />
by Type <strong>of</strong> <strong>Fishing</strong> <strong>and</strong> <strong>Hunting</strong>: <strong>2011</strong><br />
(Population 16 years old <strong>and</strong> older. Numbers in thous<strong>and</strong>s)<br />
FISHING<br />
Type <strong>of</strong> fishing <strong>and</strong> hunting<br />
Participants Days <strong>of</strong> participation Trips<br />
Number Percent Number Percent Number Percent<br />
Total, all fishing ........................... 105 100 1,854 100 1,703 100<br />
Total, all freshwater ....................... 97 92 1,808 98 1,664 98<br />
Freshwater, except Great Lakes ........... 97 92 1,808 98 1,664 98<br />
Great Lakes ........................... ... ... ... ... ... ...<br />
Saltwater ............................... *13 *12 *65 *4 *39 *2<br />
HUNTING<br />
Total, all hunting .......................... 71 100 1,614 100 1,465 100<br />
Big game ............................... 65 92 1,443 89 1,109 76<br />
Small game ............................. *25 *36 *329 *20 *208 *14<br />
Migratory birds .......................... *7 *10 *35 *2 *42 *3<br />
Other animals ........................... *19 *26 *194 *12 *106 *7<br />
* Estimate based on a sample size <strong>of</strong> 10–29. … Sample size too small (less than 10) to report data reliably.<br />
Note: Detail does not add to total because <strong>of</strong> multiple responses.<br />
18 <strong>2011</strong> <strong>National</strong> <strong>Survey</strong> <strong>of</strong> <strong>Fishing</strong>, <strong>Hunting</strong>, <strong>and</strong> Wildlife-Associated Recreation—Vermont U.S. Fish <strong>and</strong> Wildlife Service <strong>and</strong> U.S. <strong>Census</strong> <strong>Bureau</strong>


