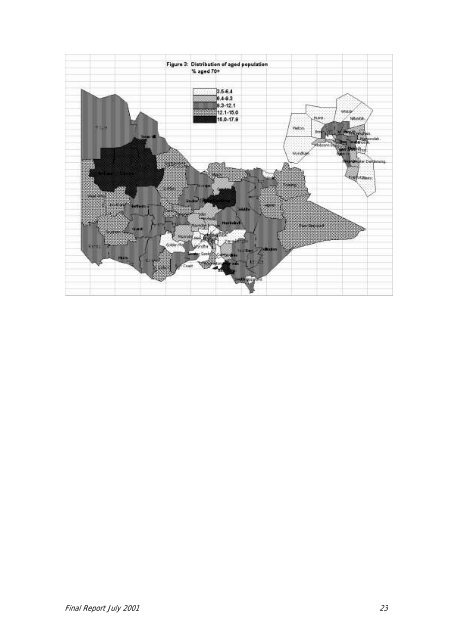
Part B: Development <strong>of</strong> Opti<strong>on</strong>s for a Revised <strong>RREF</strong> Table 1.3: Comparis<strong>on</strong>s <strong>of</strong> Base Populati<strong>on</strong> Opti<strong>on</strong>s for adjusting for Frail Aged Populati<strong>on</strong> Under 70 Over 70 Total % % No. ‘000 Total Victorian populati<strong>on</strong> <strong>2001</strong> 91 9 4,770.4 HACC Client populati<strong>on</strong> ~30 ~70 <strong>RREF</strong> 92: Handicap to age 85 in community plus total 68 32 383.4 85 and over in community Opti<strong>on</strong> 1: Handicap at all ages in community, no 71 29 366.6 adjustment for frail aged Opti<strong>on</strong> 2: Handicap to age 70, plus total 70 and over, 42 58 626.4 in community Opti<strong>on</strong> 3: Handicap to age 70, plus handicap aged 70 and over, in community, doubled. 55 45 471.6 The figures in Table 1.3 are based <strong>on</strong> the 1998 DACS populati<strong>on</strong> in private dwellings <strong>on</strong>ly and so do not corresp<strong>on</strong>d exactly with figures for <strong>RREF</strong> base populati<strong>on</strong>s given later in this <str<strong>on</strong>g>Report</str<strong>on</strong>g>. In the base populati<strong>on</strong>s discussed below, <strong>on</strong>ly residential aged care and disability accommodati<strong>on</strong> and not other forms <strong>of</strong> n<strong>on</strong>-private dwellings have been subtracted, and other adjustments have been also made as detailed below. As both Opti<strong>on</strong>s 2 and 3 give added weight to the populati<strong>on</strong> aged 70 and over it is important to identify the potential impact <strong>of</strong> this adjustment across the state. Overall, 9% <strong>of</strong> Victoria’s populati<strong>on</strong> was aged 70 and over in <strong>2001</strong>, but there are wide variati<strong>on</strong>s between LGAs. Melt<strong>on</strong> has the lowest proporti<strong>on</strong> aged 70 and over, just 3.5% and Queenscliffe the highest, 21.0%. Of the 78 LGAs, 30 have less than 9% aged 70 and over, and 20 <strong>of</strong> these are metropolitan LGAs. Of the 48 LGAs which have more than 9% aged 70 and over, 37 are rural LGAs. However, even though more rural LGAs are older than metropolitan areas, the majority <strong>of</strong> the older populati<strong>on</strong> live in metropolitan areas. The proporti<strong>on</strong> aged 70 and over is mapped in Figure 3. As weighting <strong>of</strong> base populati<strong>on</strong>s takes the absolute numbers <strong>of</strong> older people into account, the outcomes reflect the actual numbers <strong>of</strong> older people in any LGA rather than just the proporti<strong>on</strong> they comprise <strong>of</strong> the total populati<strong>on</strong>. Thus, while Queenscliff has the highest proporti<strong>on</strong> aged 70 and over, it has the third smallest number <strong>of</strong> aged resident, less than 500 people. At the same time, over <strong>on</strong>e third <strong>of</strong> the all those aged 70 and over live in just eight large metropolitan LGAs which each have over 14,000 aged residents, together with Greater Geel<strong>on</strong>g. These differences in the distributi<strong>on</strong> <strong>of</strong> the populati<strong>on</strong> aged 70 and over are amplified in Opti<strong>on</strong>s 2 and 3 in somewhat different ways. Opti<strong>on</strong> 2 gives increased weight to the populati<strong>on</strong> aged 70 and over directly by counting all aged 70 and over in. Doubling <strong>of</strong> the handicapped populati<strong>on</strong> aged 70 and over in Opti<strong>on</strong> 3 gives more weight to the oldest age groups as rates <strong>of</strong> handicap increase with advancing age. In Opti<strong>on</strong> 3, the total handicapped populati<strong>on</strong> aged 70 and over is doubled before any <strong>of</strong> the other populati<strong>on</strong> comp<strong>on</strong>ents are subtracted. The effect is then to discount the subtracti<strong>on</strong>s by 50%, and this is seen to be c<strong>on</strong>sistent with allowing some c<strong>on</strong>tinuing use <strong>of</strong> HACC services by these populati<strong>on</strong> segments as discussed further below. 1.5 OTHER EXCLUSIONS The implementati<strong>on</strong> <strong>of</strong> the Veterans’ Home Care Program in early <strong>2001</strong> was identified as having the potential to alleviate demand for HACC services as it removes eligible veterans from the HACC target populati<strong>on</strong>. The number <strong>of</strong> veterans estimated to be eligible for the VHC in early <strong>2001</strong> was 67,766. The way in which the veteran populati<strong>on</strong> should be recognised was an area <strong>of</strong> c<strong>on</strong>siderable discussi<strong>on</strong> in the Round 2 C<strong>on</strong>sultati<strong>on</strong>s and this matter is taken up below. <str<strong>on</strong>g>Final</str<strong>on</strong>g> <str<strong>on</strong>g>Report</str<strong>on</strong>g> July <strong>2001</strong> 22
<str<strong>on</strong>g>Final</str<strong>on</strong>g> <str<strong>on</strong>g>Report</str<strong>on</strong>g> July <strong>2001</strong> 23