Final Report on RREF 2001 - Department of Health
Final Report on RREF 2001 - Department of Health
Final Report on RREF 2001 - Department of Health

You also want an ePaper? Increase the reach of your titles
YUMPU automatically turns print PDFs into web optimized ePapers that Google loves.
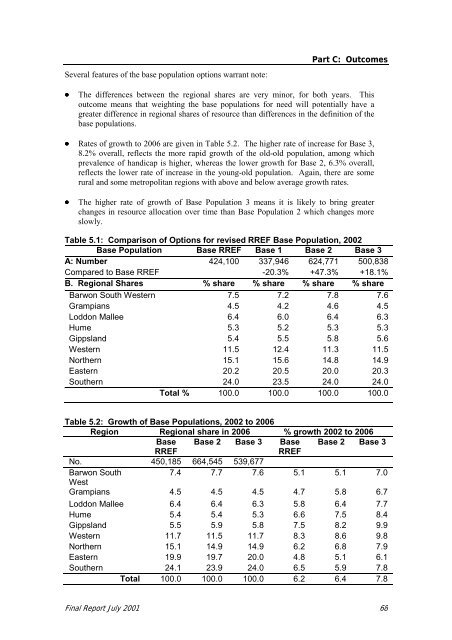
Several features <strong>of</strong> the base populati<strong>on</strong> opti<strong>on</strong>s warrant note:<br />
Part C: Outcomes<br />
• The differences between the regi<strong>on</strong>al shares are very minor, for both years. This<br />
outcome means that weighting the base populati<strong>on</strong>s for need will potentially have a<br />
greater difference in regi<strong>on</strong>al shares <strong>of</strong> resource than differences in the definiti<strong>on</strong> <strong>of</strong> the<br />
base populati<strong>on</strong>s.<br />
• Rates <strong>of</strong> growth to 2006 are given in Table 5.2. The higher rate <strong>of</strong> increase for Base 3,<br />
8.2% overall, reflects the more rapid growth <strong>of</strong> the old-old populati<strong>on</strong>, am<strong>on</strong>g which<br />
prevalence <strong>of</strong> handicap is higher, whereas the lower growth for Base 2, 6.3% overall,<br />
reflects the lower rate <strong>of</strong> increase in the young-old populati<strong>on</strong>. Again, there are some<br />
rural and some metropolitan regi<strong>on</strong>s with above and below average growth rates.<br />
• The higher rate <strong>of</strong> growth <strong>of</strong> Base Populati<strong>on</strong> 3 means it is likely to bring greater<br />
changes in resource allocati<strong>on</strong> over time than Base Populati<strong>on</strong> 2 which changes more<br />
slowly.<br />
Table 5.1: Comparis<strong>on</strong> <strong>of</strong> Opti<strong>on</strong>s for revised <strong>RREF</strong> Base Populati<strong>on</strong>, 2002<br />
Base Populati<strong>on</strong> Base <strong>RREF</strong> Base 1 Base 2 Base 3<br />
A: Number 424,100 337,946 624,771 500,838<br />
Compared to Base <strong>RREF</strong> -20.3% +47.3% +18.1%<br />
B. Regi<strong>on</strong>al Shares % share % share % share % share<br />
Barw<strong>on</strong> South Western 7.5 7.2 7.8 7.6<br />
Grampians 4.5 4.2 4.6 4.5<br />
Lodd<strong>on</strong> Mallee 6.4 6.0 6.4 6.3<br />
Hume 5.3 5.2 5.3 5.3<br />
Gippsland 5.4 5.5 5.8 5.6<br />
Western 11.5 12.4 11.3 11.5<br />
Northern 15.1 15.6 14.8 14.9<br />
Eastern 20.2 20.5 20.0 20.3<br />
Southern 24.0 23.5 24.0 24.0<br />
Total % 100.0 100.0 100.0 100.0<br />
Table 5.2: Growth <strong>of</strong> Base Populati<strong>on</strong>s, 2002 to 2006<br />
Regi<strong>on</strong> Regi<strong>on</strong>al share in 2006 % growth 2002 to 2006<br />
Base Base 2 Base 3 Base Base 2 Base 3<br />
<strong>RREF</strong><br />
<strong>RREF</strong><br />
No. 450,185 664,545 539,677<br />
Barw<strong>on</strong> South<br />
7.4 7.7 7.6 5.1 5.1 7.0<br />
West<br />
Grampians 4.5 4.5 4.5 4.7 5.8 6.7<br />
Lodd<strong>on</strong> Mallee 6.4 6.4 6.3 5.8 6.4 7.7<br />
Hume 5.4 5.4 5.3 6.6 7.5 8.4<br />
Gippsland 5.5 5.9 5.8 7.5 8.2 9.9<br />
Western 11.7 11.5 11.7 8.3 8.6 9.8<br />
Northern 15.1 14.9 14.9 6.2 6.8 7.9<br />
Eastern 19.9 19.7 20.0 4.8 5.1 6.1<br />
Southern 24.1 23.9 24.0 6.5 5.9 7.8<br />
Total 100.0 100.0 100.0 6.2 6.4 7.8<br />
<str<strong>on</strong>g>Final</str<strong>on</strong>g> <str<strong>on</strong>g>Report</str<strong>on</strong>g> July <strong>2001</strong> 68