Final Report on RREF 2001 - Department of Health
Final Report on RREF 2001 - Department of Health
Final Report on RREF 2001 - Department of Health

Create successful ePaper yourself
Turn your PDF publications into a flip-book with our unique Google optimized e-Paper software.
Part B: Development <strong>of</strong> Opti<strong>on</strong>s for a Revised <strong>RREF</strong><br />
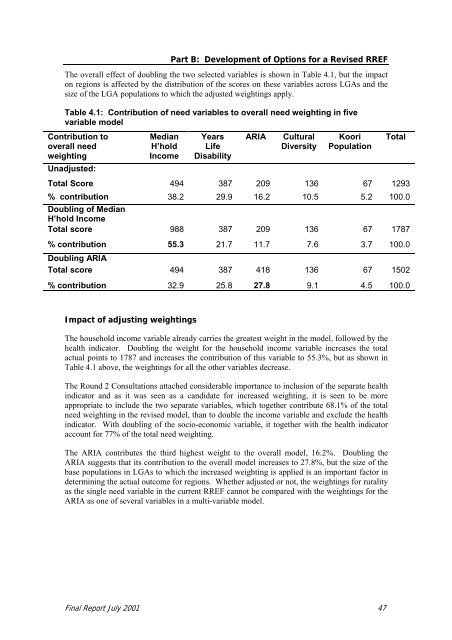
The overall effect <strong>of</strong> doubling the two selected variables is shown in Table 4.1, but the impact<br />
<strong>on</strong> regi<strong>on</strong>s is affected by the distributi<strong>on</strong> <strong>of</strong> the scores <strong>on</strong> these variables across LGAs and the<br />
size <strong>of</strong> the LGA populati<strong>on</strong>s to which the adjusted weightings apply.<br />
Table 4.1: C<strong>on</strong>tributi<strong>on</strong> <strong>of</strong> need variables to overall need weighting in five<br />
variable model<br />
C<strong>on</strong>tributi<strong>on</strong> to<br />
overall need<br />
weighting<br />
Median<br />
H’hold<br />
Income<br />
Years<br />
Life<br />
Disability<br />
ARIA<br />
Cultural<br />
Diversity<br />
Koori<br />
Populati<strong>on</strong><br />
Total<br />
Unadjusted:<br />
Total Score 494 387 209 136 67 1293<br />
% c<strong>on</strong>tributi<strong>on</strong> 38.2 29.9 16.2 10.5 5.2 100.0<br />
Doubling <strong>of</strong> Median<br />
H’hold Income<br />
Total score 988 387 209 136 67 1787<br />
% c<strong>on</strong>tributi<strong>on</strong> 55.3 21.7 11.7 7.6 3.7 100.0<br />
Doubling ARIA<br />
Total score 494 387 418 136 67 1502<br />
% c<strong>on</strong>tributi<strong>on</strong> 32.9 25.8 27.8 9.1 4.5 100.0<br />
Impact <strong>of</strong> adjusting weightings<br />
The household income variable already carries the greatest weight in the model, followed by the<br />
health indicator. Doubling the weight for the household income variable increases the total<br />
actual points to 1787 and increases the c<strong>on</strong>tributi<strong>on</strong> <strong>of</strong> this variable to 55.3%, but as shown in<br />
Table 4.1 above, the weightings for all the other variables decrease.<br />
The Round 2 C<strong>on</strong>sultati<strong>on</strong>s attached c<strong>on</strong>siderable importance to inclusi<strong>on</strong> <strong>of</strong> the separate health<br />
indicator and as it was seen as a candidate for increased weighting, it is seen to be more<br />
appropriate to include the two separate variables, which together c<strong>on</strong>tribute 68.1% <strong>of</strong> the total<br />
need weighting in the revised model, than to double the income variable and exclude the health<br />
indicator. With doubling <strong>of</strong> the socio-ec<strong>on</strong>omic variable, it together with the health indicator<br />
account for 77% <strong>of</strong> the total need weighting.<br />
The ARIA c<strong>on</strong>tributes the third highest weight to the overall model, 16.2%. Doubling the<br />
ARIA suggests that its c<strong>on</strong>tributi<strong>on</strong> to the overall model increases to 27.8%, but the size <strong>of</strong> the<br />
base populati<strong>on</strong>s in LGAs to which the increased weighting is applied is an important factor in<br />
determining the actual outcome for regi<strong>on</strong>s. Whether adjusted or not, the weightings for rurality<br />
as the single need variable in the current <strong>RREF</strong> cannot be compared with the weightings for the<br />
ARIA as <strong>on</strong>e <strong>of</strong> several variables in a multi-variable model.<br />
<str<strong>on</strong>g>Final</str<strong>on</strong>g> <str<strong>on</strong>g>Report</str<strong>on</strong>g> July <strong>2001</strong> 47