Final Report on RREF 2001 - Department of Health
Final Report on RREF 2001 - Department of Health
Final Report on RREF 2001 - Department of Health

Create successful ePaper yourself
Turn your PDF publications into a flip-book with our unique Google optimized e-Paper software.
Part C: Outcomes<br />
• The Northern and Southern Metropolitan Regi<strong>on</strong>s and Lodd<strong>on</strong> Mallee are<br />
characterised by extreme variati<strong>on</strong>, more than 40%, between LGAs within each<br />
regi<strong>on</strong>;<br />
• Gippsland stands out as having similarly high levels <strong>of</strong> need across all LGAs,<br />
starting from a highest base, 31%, with a range <strong>of</strong> 33%.<br />
In applying the need weightings to determine regi<strong>on</strong>al allocati<strong>on</strong>s <strong>of</strong> growth funds, it needs to be<br />
emphasised that:<br />
• The share <strong>of</strong> growth funds received will depend <strong>on</strong> the size <strong>of</strong> the total populati<strong>on</strong><br />
<strong>of</strong> each LGA as well as the weighting.<br />
• The average <strong>of</strong> the weightings across the LGAs in each regi<strong>on</strong> is given for<br />
comparis<strong>on</strong> purposes <strong>on</strong>ly and does not translate into the weighted populati<strong>on</strong> for<br />
the regi<strong>on</strong>, nor can growth funds for regi<strong>on</strong>s be estimated simply by applying the<br />
average weighting to the base resources currently received. The weighted regi<strong>on</strong>al<br />
populati<strong>on</strong>s for the <strong>RREF</strong> are built by adding the weighted base populati<strong>on</strong> for each<br />
LGA, these regi<strong>on</strong>al totals are then calculated as a share <strong>of</strong> the total <strong>RREF</strong> weighted<br />
base populati<strong>on</strong> for the state, and growth funds are allocated in proporti<strong>on</strong> to those<br />
shares.<br />
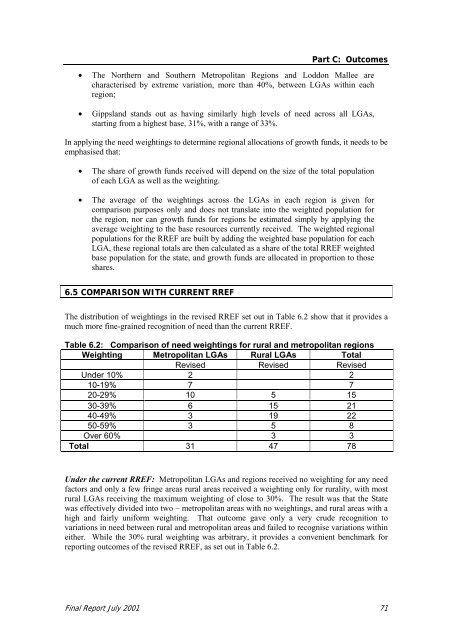
6.5 COMPARISON WITH CURRENT <strong>RREF</strong><br />
The distributi<strong>on</strong> <strong>of</strong> weightings in the revised <strong>RREF</strong> set out in Table 6.2 show that it provides a<br />
much more fine-grained recogniti<strong>on</strong> <strong>of</strong> need than the current <strong>RREF</strong>.<br />
Table 6.2: Comparis<strong>on</strong> <strong>of</strong> need weightings for rural and metropolitan regi<strong>on</strong>s<br />
Weighting Metropolitan LGAs Rural LGAs Total<br />
Revised Revised Revised<br />
Under 10% 2 2<br />
10-19% 7 7<br />
20-29% 10 5 15<br />
30-39% 6 15 21<br />
40-49% 3 19 22<br />
50-59% 3 5 8<br />
Over 60% 3 3<br />
Total 31 47 78<br />
Under the current <strong>RREF</strong>: Metropolitan LGAs and regi<strong>on</strong>s received no weighting for any need<br />
factors and <strong>on</strong>ly a few fringe areas rural areas received a weighting <strong>on</strong>ly for rurality, with most<br />
rural LGAs receiving the maximum weighting <strong>of</strong> close to 30%. The result was that the State<br />
was effectively divided into two – metropolitan areas with no weightings, and rural areas with a<br />
high and fairly uniform weighting. That outcome gave <strong>on</strong>ly a very crude recogniti<strong>on</strong> to<br />
variati<strong>on</strong>s in need between rural and metropolitan areas and failed to recognise variati<strong>on</strong>s within<br />
either. While the 30% rural weighting was arbitrary, it provides a c<strong>on</strong>venient benchmark for<br />
reporting outcomes <strong>of</strong> the revised <strong>RREF</strong>, as set out in Table 6.2.<br />
<str<strong>on</strong>g>Final</str<strong>on</strong>g> <str<strong>on</strong>g>Report</str<strong>on</strong>g> July <strong>2001</strong> 71