Final Report on RREF 2001 - Department of Health
Final Report on RREF 2001 - Department of Health
Final Report on RREF 2001 - Department of Health

You also want an ePaper? Increase the reach of your titles
YUMPU automatically turns print PDFs into web optimized ePapers that Google loves.
Part C: Outcomes<br />
6.3 FURTHER ISSUES AND VIEWS ON OUTCOMES<br />
• There was wide agreement in the Round 2 C<strong>on</strong>sultati<strong>on</strong>s that the patterns <strong>of</strong> need shown by<br />
the need weightings at regi<strong>on</strong>al level and for LGAs reflected experience in the field. Three<br />
aspects <strong>of</strong> the results were noted in particular:<br />
1. The relatively limited gradati<strong>on</strong> in the average need weightings across the nine<br />
regi<strong>on</strong>s;<br />
2. The more marked variati<strong>on</strong>s between LGAs within regi<strong>on</strong>s; and<br />
3. The insights into variati<strong>on</strong>s in need within regi<strong>on</strong>s provided by the LGA data<br />
compiled for the <strong>RREF</strong> and the value <strong>of</strong> having this data available for use in<br />
regi<strong>on</strong>al and local planning.<br />
6.4 REVISED REGIONAL OUTCOMES OF WEIGHTING FOR NEED VARIABLES<br />
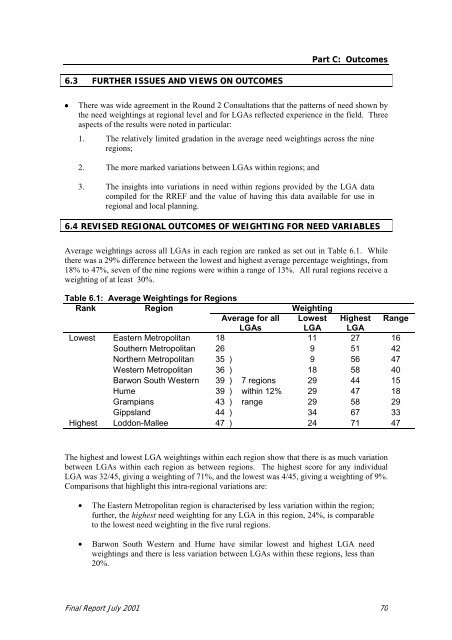
Average weightings across all LGAs in each regi<strong>on</strong> are ranked as set out in Table 6.1. While<br />
there was a 29% difference between the lowest and highest average percentage weightings, from<br />
18% to 47%, seven <strong>of</strong> the nine regi<strong>on</strong>s were within a range <strong>of</strong> 13%. All rural regi<strong>on</strong>s receive a<br />
weighting <strong>of</strong> at least 30%.<br />
Table 6.1: Average Weightings for Regi<strong>on</strong>s<br />
Rank<br />
Regi<strong>on</strong><br />
Weighting<br />
Average for all Lowest Highest Range<br />
LGAs<br />
LGA LGA<br />
Lowest Eastern Metropolitan 18 11 27 16<br />
Southern Metropolitan 26 9 51 42<br />
Northern Metropolitan 35 ) 9 56 47<br />
Western Metropolitan 36 ) 18 58 40<br />
Barw<strong>on</strong> South Western 39 ) 7 regi<strong>on</strong>s 29 44 15<br />
Hume 39 ) within 12% 29 47 18<br />
Grampians 43 ) range 29 58 29<br />
Gippsland 44 ) 34 67 33<br />
Highest Lodd<strong>on</strong>-Mallee 47 ) 24 71 47<br />
The highest and lowest LGA weightings within each regi<strong>on</strong> show that there is as much variati<strong>on</strong><br />
between LGAs within each regi<strong>on</strong> as between regi<strong>on</strong>s. The highest score for any individual<br />
LGA was 32/45, giving a weighting <strong>of</strong> 71%, and the lowest was 4/45, giving a weighting <strong>of</strong> 9%.<br />
Comparis<strong>on</strong>s that highlight this intra-regi<strong>on</strong>al variati<strong>on</strong>s are:<br />
• The Eastern Metropolitan regi<strong>on</strong> is characterised by less variati<strong>on</strong> within the regi<strong>on</strong>;<br />
further, the highest need weighting for any LGA in this regi<strong>on</strong>, 24%, is comparable<br />
to the lowest need weighting in the five rural regi<strong>on</strong>s.<br />
• Barw<strong>on</strong> South Western and Hume have similar lowest and highest LGA need<br />
weightings and there is less variati<strong>on</strong> between LGAs within these regi<strong>on</strong>s, less than<br />
20%.<br />
<str<strong>on</strong>g>Final</str<strong>on</strong>g> <str<strong>on</strong>g>Report</str<strong>on</strong>g> July <strong>2001</strong> 70