Final Report on RREF 2001 - Department of Health
Final Report on RREF 2001 - Department of Health
Final Report on RREF 2001 - Department of Health

You also want an ePaper? Increase the reach of your titles
YUMPU automatically turns print PDFs into web optimized ePapers that Google loves.
Part C: Outcomes<br />
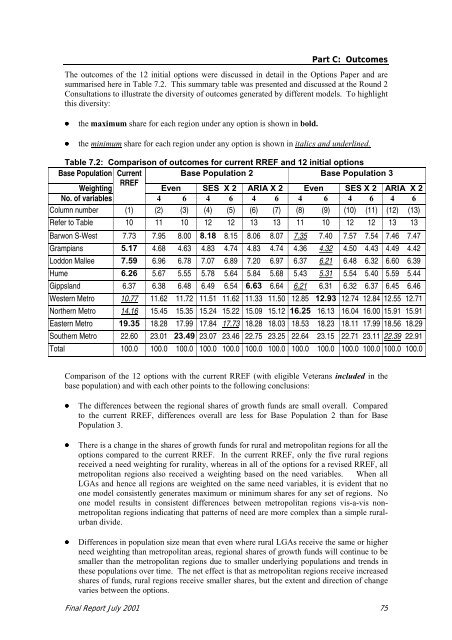
The outcomes <strong>of</strong> the 12 initial opti<strong>on</strong>s were discussed in detail in the Opti<strong>on</strong>s Paper and are<br />
summarised here in Table 7.2. This summary table was presented and discussed at the Round 2<br />
C<strong>on</strong>sultati<strong>on</strong>s to illustrate the diversity <strong>of</strong> outcomes generated by different models. To highlight<br />
this diversity:<br />
• the maximum share for each regi<strong>on</strong> under any opti<strong>on</strong> is shown in bold.<br />
• the minimum share for each regi<strong>on</strong> under any opti<strong>on</strong> is shown in italics and underlined.<br />
Table 7.2: Comparis<strong>on</strong> <strong>of</strong> outcomes for current <strong>RREF</strong> and 12 initial opti<strong>on</strong>s<br />
Base Populati<strong>on</strong> Current Base Populati<strong>on</strong> 2 Base Populati<strong>on</strong> 3<br />
Weighting<br />
<strong>RREF</strong><br />
Even SES X 2 ARIA X 2 Even SES X 2 ARIA X 2<br />
No. <strong>of</strong> variables<br />
4 6 4 6 4 6 4 6 4 6 4 6<br />
Column number (1) (2) (3) (4) (5) (6) (7) (8) (9) (10) (11) (12) (13)<br />
Refer to Table 10 11 10 12 12 13 13 11 10 12 12 13 13<br />
Barw<strong>on</strong> S-West 7.73 7.95 8.00 8.18 8.15 8.06 8.07 7.35 7.40 7.57 7.54 7.46 7.47<br />
Grampians 5.17 4.68 4.63 4.83 4.74 4.83 4.74 4.36 4.32 4.50 4.43 4.49 4.42<br />
Lodd<strong>on</strong> Mallee 7.59 6.96 6.78 7.07 6.89 7.20 6.97 6.37 6.21 6.48 6.32 6.60 6.39<br />
Hume 6.26 5.67 5.55 5.78 5.64 5.84 5.68 5.43 5.31 5.54 5.40 5.59 5.44<br />
Gippsland 6.37 6.38 6.48 6.49 6.54 6.63 6.64 6.21 6.31 6.32 6.37 6.45 6.46<br />
Western Metro 10.77 11.62 11.72 11.51 11.62 11.33 11.50 12.85 12.93 12.74 12.84 12.55 12.71<br />
Northern Metro 14.16 15.45 15.35 15.24 15.22 15.09 15.12 16.25 16.13 16.04 16.00 15.91 15.91<br />
Eastern Metro 19.35 18.28 17.99 17.84 17.73 18.28 18.03 18.53 18.23 18.11 17.99 18.56 18.29<br />
Southern Metro 22.60 23.01 23.49 23.07 23.46 22.75 23.25 22.64 23.15 22.71 23.11 22.39 22.91<br />
Total 100.0 100.0 100.0 100.0 100.0 100.0 100.0 100.0 100.0 100.0 100.0 100.0 100.0<br />
Comparis<strong>on</strong> <strong>of</strong> the 12 opti<strong>on</strong>s with the current <strong>RREF</strong> (with eligible Veterans included in the<br />
base populati<strong>on</strong>) and with each other points to the following c<strong>on</strong>clusi<strong>on</strong>s:<br />
• The differences between the regi<strong>on</strong>al shares <strong>of</strong> growth funds are small overall. Compared<br />
to the current <strong>RREF</strong>, differences overall are less for Base Populati<strong>on</strong> 2 than for Base<br />
Populati<strong>on</strong> 3.<br />
• There is a change in the shares <strong>of</strong> growth funds for rural and metropolitan regi<strong>on</strong>s for all the<br />
opti<strong>on</strong>s compared to the current <strong>RREF</strong>. In the current <strong>RREF</strong>, <strong>on</strong>ly the five rural regi<strong>on</strong>s<br />
received a need weighting for rurality, whereas in all <strong>of</strong> the opti<strong>on</strong>s for a revised <strong>RREF</strong>, all<br />
metropolitan regi<strong>on</strong>s also received a weighting based <strong>on</strong> the need variables. When all<br />
LGAs and hence all regi<strong>on</strong>s are weighted <strong>on</strong> the same need variables, it is evident that no<br />
<strong>on</strong>e model c<strong>on</strong>sistently generates maximum or minimum shares for any set <strong>of</strong> regi<strong>on</strong>s. No<br />
<strong>on</strong>e model results in c<strong>on</strong>sistent differences between metropolitan regi<strong>on</strong>s vis-a-vis n<strong>on</strong>metropolitan<br />
regi<strong>on</strong>s indicating that patterns <strong>of</strong> need are more complex than a simple ruralurban<br />
divide.<br />
• Differences in populati<strong>on</strong> size mean that even where rural LGAs receive the same or higher<br />
need weighting than metropolitan areas, regi<strong>on</strong>al shares <strong>of</strong> growth funds will c<strong>on</strong>tinue to be<br />
smaller than the metropolitan regi<strong>on</strong>s due to smaller underlying populati<strong>on</strong>s and trends in<br />
these populati<strong>on</strong>s over time. The net effect is that as metropolitan regi<strong>on</strong>s receive increased<br />
shares <strong>of</strong> funds, rural regi<strong>on</strong>s receive smaller shares, but the extent and directi<strong>on</strong> <strong>of</strong> change<br />
varies between the opti<strong>on</strong>s.<br />
<str<strong>on</strong>g>Final</str<strong>on</strong>g> <str<strong>on</strong>g>Report</str<strong>on</strong>g> July <strong>2001</strong> 75