azu_td_1349475_sip1_... - Arizona Campus Repository
azu_td_1349475_sip1_... - Arizona Campus Repository
azu_td_1349475_sip1_... - Arizona Campus Repository

Create successful ePaper yourself
Turn your PDF publications into a flip-book with our unique Google optimized e-Paper software.
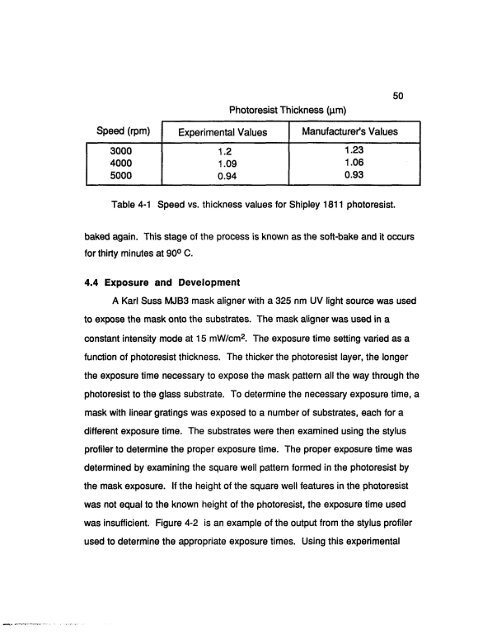
Photoresist Thickness (|xm)<br />
50<br />
Speed (rpm) Experimental Values Manufacturer's Values<br />
3000 1.2 1.23<br />
4000 1.09 1.06<br />
5000 0.94 0.93<br />
Table 4-1 Speed vs. thickness values for Shipley 1811 photoresist.<br />
baked again. This stage of the process is known as the soft-bake and it occurs<br />
for thirty minutes at 90° C.<br />
4.4 Exposure and Development<br />
A Karl Suss MJB3 mask aligner with a 325 nm UV light source was used<br />
to expose the mask onto the substrates. The mask aligner was used in a<br />
constant intensity mode at 15 mW/cm 2 . The exposure time setting varied as a<br />
function of photoresist thickness. The thicker the photoresist layer, the longer<br />
the exposure time necessary to expose the mask pattern all the way through the<br />
photoresist to the glass substrate. To determine the necessary exposure time, a<br />
mask with linear gratings was exposed to a number of substrates, each for a<br />
different exposure time. The substrates were then examined using the stylus<br />
profiler to determine the proper exposure time. The proper exposure time was<br />
determined by examining the square well pattern formed in the photoresist by<br />
the mask exposure. If the height of the square well features in the photoresist<br />
was not equal to the known height of the photoresist, the exposure time used<br />
was insufficient. Figure 4-2 is an example of the output from the stylus profiler<br />
used to determine the appropriate exposure times. Using this experimental