download the full article here - E-International Scientific Research ...
download the full article here - E-International Scientific Research ...
download the full article here - E-International Scientific Research ...

Create successful ePaper yourself
Turn your PDF publications into a flip-book with our unique Google optimized e-Paper software.
E-<strong>International</strong> <strong>Scientific</strong> <strong>Research</strong> Journal<br />
ISSN: 2094-1749 Volume: 3 Issue: 2, 2011<br />
(57 %), 24 stream orders have a value between 1 and 2 Km for first order streams and for o<strong>the</strong>rs<br />
Lu given in Table 2.<br />
Drainage density (Dd): Drainage density (Dd) is <strong>the</strong> total length of <strong>the</strong> stream in a given<br />
drainage basin divided by <strong>the</strong> area of drainage basin (Horton, 1932).<br />
Dd= ∑L/A,<br />
W<strong>here</strong> ∑L- total length of <strong>the</strong> stream,<br />
A- Area of drainage basin.<br />
Table 2 depicts <strong>the</strong> distribution of third order basins under different drainage density groups. The<br />
Dd value of DRB is 1.82 Km/km 2 . The study of TOSBs revealed that average Dd is 2.67 km/km 2<br />
and it varies in between 1.47 km/km 2 to 7.88 km/km 2 (Table-2). The highest Dd is for <strong>the</strong> TOSB<br />
15, 16, 20, and 22. With a value of 7.37, 7.42, 6.76, 7.88 respectively is situated nearest to <strong>the</strong><br />
highest rainfall occurring region such as Ghughukhan ,Maniya and Binayak. The TOSB 10 with<br />
lowest Dd value with 1.44, nearer to <strong>the</strong> lowest rainfall occurring region such as Fa<strong>the</strong>hpur. The<br />
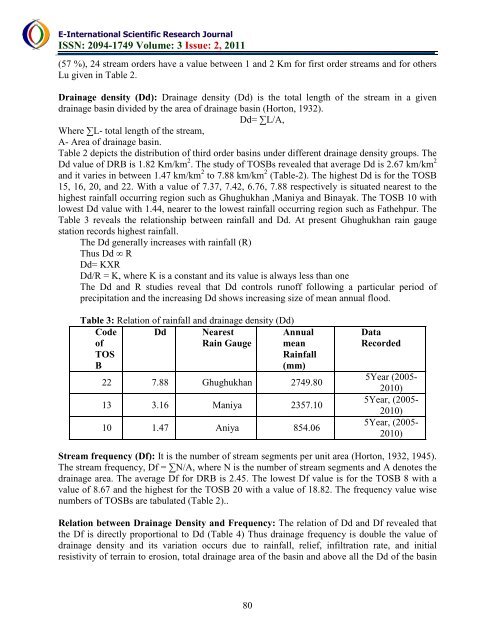
Table 3 reveals <strong>the</strong> relationship between rainfall and Dd. At present Ghughukhan rain gauge<br />
station records highest rainfall.<br />
The Dd generally increases with rainfall (R)<br />
Thus Dd ∞ R<br />
Dd= KXR<br />
Dd/R = K, w<strong>here</strong> K is a constant and its value is always less than one<br />
The Dd and R studies reveal that Dd controls runoff following a particular period of<br />
precipitation and <strong>the</strong> increasing Dd shows increasing size of mean annual flood.<br />
Table 3: Relation of rainfall and drainage density (Dd)<br />
Code<br />
of<br />
TOS<br />
B<br />
Dd Nearest<br />
Rain Gauge<br />
Annual<br />
mean<br />
Rainfall<br />
(mm)<br />
22 7.88 Ghughukhan 2749.80<br />
13 3.16 Maniya 2357.10<br />
10 1.47 Aniya 854.06<br />
Data<br />
Recorded<br />
5Year (2005-<br />
2010)<br />
5Year, (2005-<br />
2010)<br />
5Year, (2005-<br />
2010)<br />
Stream frequency (Df): It is <strong>the</strong> number of stream segments per unit area (Horton, 1932, 1945).<br />
The stream frequency, Df = ∑N/A, w<strong>here</strong> N is <strong>the</strong> number of stream segments and A denotes <strong>the</strong><br />
drainage area. The average Df for DRB is 2.45. The lowest Df value is for <strong>the</strong> TOSB 8 with a<br />
value of 8.67 and <strong>the</strong> highest for <strong>the</strong> TOSB 20 with a value of 18.82. The frequency value wise<br />
numbers of TOSBs are tabulated (Table 2)..<br />
Relation between Drainage Density and Frequency: The relation of Dd and Df revealed that<br />
<strong>the</strong> Df is directly proportional to Dd (Table 4) Thus drainage frequency is double <strong>the</strong> value of<br />
drainage density and its variation occurs due to rainfall, relief, infiltration rate, and initial<br />
resistivity of terrain to erosion, total drainage area of <strong>the</strong> basin and above all <strong>the</strong> Dd of <strong>the</strong> basin<br />
80