download the full article here - E-International Scientific Research ...
download the full article here - E-International Scientific Research ...
download the full article here - E-International Scientific Research ...

You also want an ePaper? Increase the reach of your titles
YUMPU automatically turns print PDFs into web optimized ePapers that Google loves.
E-<strong>International</strong> <strong>Scientific</strong> <strong>Research</strong> Journal<br />
ISSN: 2094-1749 Volume: 3 Issue: 2, 2011<br />
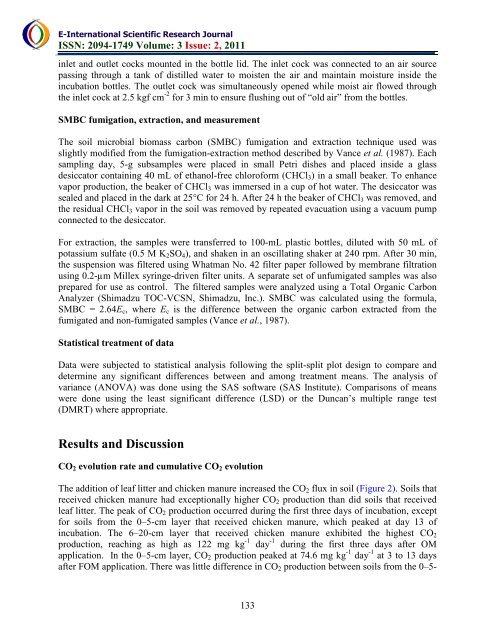
inlet and outlet cocks mounted in <strong>the</strong> bottle lid. The inlet cock was connected to an air source<br />
passing through a tank of distilled water to moisten <strong>the</strong> air and maintain moisture inside <strong>the</strong><br />
incubation bottles. The outlet cock was simultaneously opened while moist air flowed through<br />
<strong>the</strong> inlet cock at 2.5 kgf cm -2 for 3 min to ensure flushing out of “old air” from <strong>the</strong> bottles.<br />
SMBC fumigation, extraction, and measurement<br />
The soil microbial biomass carbon (SMBC) fumigation and extraction technique used was<br />
slightly modified from <strong>the</strong> fumigation-extraction method described by Vance et al. (1987). Each<br />
sampling day, 5-g subsamples were placed in small Petri dishes and placed inside a glass<br />
desiccator containing 40 mL of ethanol-free chloroform (CHCl 3 ) in a small beaker. To enhance<br />
vapor production, <strong>the</strong> beaker of CHCl 3 was immersed in a cup of hot water. The desiccator was<br />
sealed and placed in <strong>the</strong> dark at 25°C for 24 h. After 24 h <strong>the</strong> beaker of CHCl 3 was removed, and<br />
<strong>the</strong> residual CHCl 3 vapor in <strong>the</strong> soil was removed by repeated evacuation using a vacuum pump<br />
connected to <strong>the</strong> desiccator.<br />
For extraction, <strong>the</strong> samples were transferred to 100-mL plastic bottles, diluted with 50 mL of<br />
potassium sulfate (0.5 M K 2 SO 4 ), and shaken in an oscillating shaker at 240 rpm. After 30 min,<br />
<strong>the</strong> suspension was filtered using Whatman No. 42 filter paper followed by membrane filtration<br />
using 0.2-µm Millex syringe-driven filter units. A separate set of unfumigated samples was also<br />
prepared for use as control. The filtered samples were analyzed using a Total Organic Carbon<br />
Analyzer (Shimadzu TOC-VCSN, Shimadzu, Inc.). SMBC was calculated using <strong>the</strong> formula,<br />
SMBC = 2.64E c , w<strong>here</strong> E c is <strong>the</strong> difference between <strong>the</strong> organic carbon extracted from <strong>the</strong><br />
fumigated and non-fumigated samples (Vance et al., 1987).<br />
Statistical treatment of data<br />
Data were subjected to statistical analysis following <strong>the</strong> split-split plot design to compare and<br />
determine any significant differences between and among treatment means. The analysis of<br />
variance (ANOVA) was done using <strong>the</strong> SAS software (SAS Institute). Comparisons of means<br />
were done using <strong>the</strong> least significant difference (LSD) or <strong>the</strong> Duncan’s multiple range test<br />
(DMRT) w<strong>here</strong> appropriate.<br />
Results and Discussion<br />
CO 2 evolution rate and cumulative CO 2 evolution<br />
The addition of leaf litter and chicken manure increased <strong>the</strong> CO 2 flux in soil (Figure 2). Soils that<br />
received chicken manure had exceptionally higher CO 2 production than did soils that received<br />
leaf litter. The peak of CO 2 production occurred during <strong>the</strong> first three days of incubation, except<br />
for soils from <strong>the</strong> 0–5-cm layer that received chicken manure, which peaked at day 13 of<br />
incubation. The 6–20-cm layer that received chicken manure exhibited <strong>the</strong> highest CO 2<br />
production, reaching as high as 122 mg kg -1 day -1 during <strong>the</strong> first three days after OM<br />
application. In <strong>the</strong> 0–5-cm layer, CO 2 production peaked at 74.6 mg kg -1 day -1 at 3 to 13 days<br />
after FOM application. T<strong>here</strong> was little difference in CO 2 production between soils from <strong>the</strong> 0–5-<br />
133