download the full article here - E-International Scientific Research ...
download the full article here - E-International Scientific Research ...
download the full article here - E-International Scientific Research ...

You also want an ePaper? Increase the reach of your titles
YUMPU automatically turns print PDFs into web optimized ePapers that Google loves.
E-<strong>International</strong> <strong>Scientific</strong> <strong>Research</strong> Journal<br />
ISSN: 2094-1749 Volume: 3 Issue: 2, 2011<br />
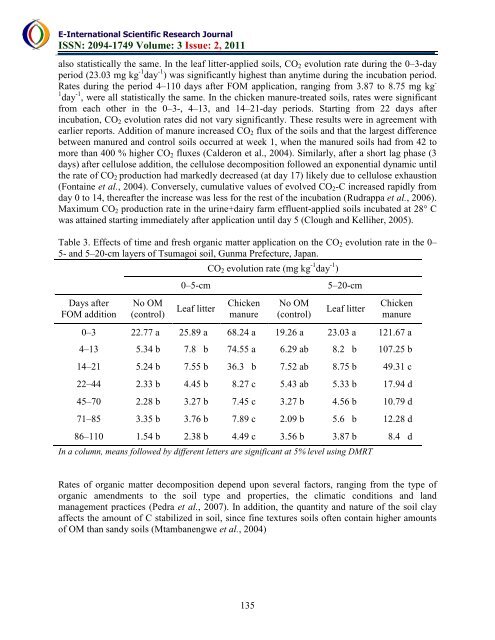
also statistically <strong>the</strong> same. In <strong>the</strong> leaf litter-applied soils, CO 2 evolution rate during <strong>the</strong> 0–3-day<br />
period (23.03 mg kg -1 day -1 ) was significantly highest than anytime during <strong>the</strong> incubation period.<br />
Rates during <strong>the</strong> period 4–110 days after FOM application, ranging from 3.87 to 8.75 mg kg -<br />
1 day -1 , were all statistically <strong>the</strong> same. In <strong>the</strong> chicken manure-treated soils, rates were significant<br />
from each o<strong>the</strong>r in <strong>the</strong> 0–3-, 4–13, and 14–21-day periods. Starting from 22 days after<br />
incubation, CO 2 evolution rates did not vary significantly. These results were in agreement with<br />
earlier reports. Addition of manure increased CO 2 flux of <strong>the</strong> soils and that <strong>the</strong> largest difference<br />
between manured and control soils occurred at week 1, when <strong>the</strong> manured soils had from 42 to<br />
more than 400 % higher CO 2 fluxes (Calderon et al., 2004). Similarly, after a short lag phase (3<br />
days) after cellulose addition, <strong>the</strong> cellulose decomposition followed an exponential dynamic until<br />
<strong>the</strong> rate of CO 2 production had markedly decreased (at day 17) likely due to cellulose exhaustion<br />
(Fontaine et al., 2004). Conversely, cumulative values of evolved CO 2 -C increased rapidly from<br />
day 0 to 14, <strong>the</strong>reafter <strong>the</strong> increase was less for <strong>the</strong> rest of <strong>the</strong> incubation (Rudrappa et al., 2006).<br />
Maximum CO 2 production rate in <strong>the</strong> urine+dairy farm effluent-applied soils incubated at 28° C<br />
was attained starting immediately after application until day 5 (Clough and Kelliher, 2005).<br />
Table 3. Effects of time and fresh organic matter application on <strong>the</strong> CO 2 evolution rate in <strong>the</strong> 0–<br />
5- and 5–20-cm layers of Tsumagoi soil, Gunma Prefecture, Japan.<br />
Days after<br />
FOM addition<br />
No OM<br />
(control)<br />
0–5-cm<br />
Leaf litter<br />
CO 2 evolution rate (mg kg -1 day -1 )<br />
Chicken<br />
manure<br />
No OM<br />
(control)<br />
5–20-cm<br />
Leaf litter<br />
Chicken<br />
manure<br />
0–3 22.77 a 25.89 a 68.24 a 19.26 a 23.03 a 121.67 a<br />
4–13 5.34 b 7.8 b 74.55 a 6.29 ab 8.2 b 107.25 b<br />
14–21 5.24 b 7.55 b 36.3 b 7.52 ab 8.75 b 49.31 c<br />
22–44 2.33 b 4.45 b 8.27 c 5.43 ab 5.33 b 17.94 d<br />
45–70 2.28 b 3.27 b 7.45 c 3.27 b 4.56 b 10.79 d<br />
71–85 3.35 b 3.76 b 7.89 c 2.09 b 5.6 b 12.28 d<br />
86–110 1.54 b 2.38 b 4.49 c 3.56 b 3.87 b 8.4 d<br />
In a column, means followed by different letters are significant at 5% level using DMRT<br />
Rates of organic matter decomposition depend upon several factors, ranging from <strong>the</strong> type of<br />
organic amendments to <strong>the</strong> soil type and properties, <strong>the</strong> climatic conditions and land<br />
management practices (Pedra et al., 2007). In addition, <strong>the</strong> quantity and nature of <strong>the</strong> soil clay<br />
affects <strong>the</strong> amount of C stabilized in soil, since fine textures soils often contain higher amounts<br />
of OM than sandy soils (Mtambanengwe et al., 2004)<br />
135