download the full article here - E-International Scientific Research ...
download the full article here - E-International Scientific Research ...
download the full article here - E-International Scientific Research ...

Create successful ePaper yourself
Turn your PDF publications into a flip-book with our unique Google optimized e-Paper software.
E-<strong>International</strong> <strong>Scientific</strong> <strong>Research</strong> Journal<br />
ISSN: 2094-1749 Volume: 3 Issue: 2, 2011<br />
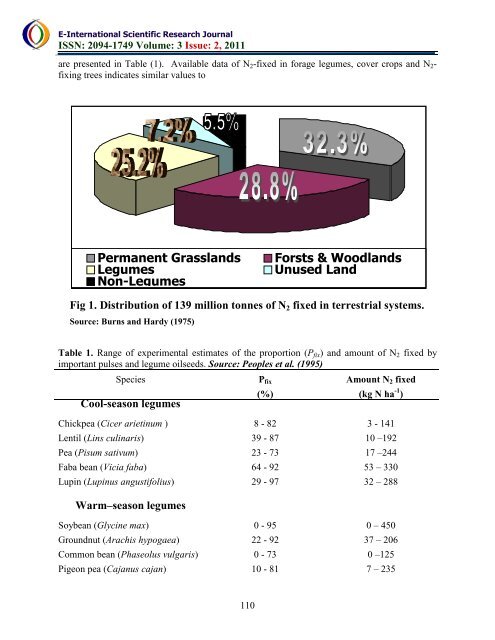
are presented in Table (1). Available data of N 2 -fixed in forage legumes, cover crops and N 2 -<br />
fixing trees indicates similar values to<br />
Permanent Grasslands<br />
Legumes<br />
Non-Legumes<br />
Forsts & Woodlands<br />
Unused Land<br />
Fig 1. Distribution of 139 million tonnes of N 2 fixed in terrestrial systems.<br />
Source: Burns and Hardy (1975)<br />
Table 1. Range of experimental estimates of <strong>the</strong> proportion (P fix ) and amount of N 2 fixed by<br />
important pulses and legume oilseeds. Source: Peoples et al. (1995)<br />
Species P fix Amount N 2 fixed<br />
Cool-season legumes<br />
(%) (kg N ha -1 )<br />
Chickpea (Cicer arietinum ) 8 - 82 3 - 141<br />
Lentil (Lins culinaris) 39 - 87 10 –192<br />
Pea (Pisum sativum) 23 - 73 17 –244<br />
Faba bean (Vicia faba) 64 - 92 53 – 330<br />
Lupin (Lupinus angustifolius) 29 - 97 32 – 288<br />
Warm–season legumes<br />
Soybean (Glycine max) 0 - 95 0 – 450<br />
Groundnut (Arachis hypogaea) 22 - 92 37 – 206<br />
Common bean (Phaseolus vulgaris) 0 - 73 0 –125<br />
Pigeon pea (Cajanus cajan) 10 - 81 7 – 235<br />
110