download the full article here - E-International Scientific Research ...
download the full article here - E-International Scientific Research ...
download the full article here - E-International Scientific Research ...

You also want an ePaper? Increase the reach of your titles
YUMPU automatically turns print PDFs into web optimized ePapers that Google loves.
E-<strong>International</strong> <strong>Scientific</strong> <strong>Research</strong> Journal<br />
ISSN: 2094-1749 Volume: 3 Issue: 2, 2011<br />
cm (0.49) and 6–20-cm (0.52 mg CO 2 kg -1 day -1 ) layers that received leaf litter during <strong>the</strong> 120-<br />
day incubation period.<br />
The carbon equivalent of <strong>the</strong> total CO 2 produced in <strong>the</strong> 0–5- and 6–20-cm layers of soil and<br />
between <strong>the</strong> control and leaf litter treatments ranged from 109 to 178 mg kg -1 for <strong>the</strong> 120-day<br />
incubation period. For soils that received chicken manure, <strong>the</strong> carbon equivalent reached as high<br />
as 527 and 828 mg carbon kg -1 for <strong>the</strong> 0–5- and 6–20-cm layers, respectively.<br />
CO2 evolution rate (mg kg -1 day -1 )<br />
180<br />
160<br />
140<br />
120<br />
100<br />
80<br />
60<br />
40<br />
20<br />
0<br />
0-5 cm No OM (control) 5-20 cm No OM (control)<br />
0-5 cm Chicken manure 5-20 cm Chicken manure<br />
0-5 cm Leaf litter 5-20 cm Leaf litter<br />
0 10 20 30 40 50 60 70 80 90 100 110<br />
Time (days)<br />
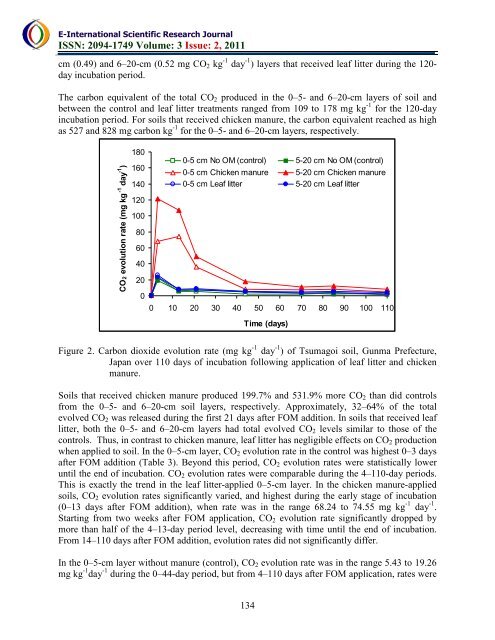
Figure 2. Carbon dioxide evolution rate (mg kg -1 day -1 ) of Tsumagoi soil, Gunma Prefecture,<br />
Japan over 110 days of incubation following application of leaf litter and chicken<br />
manure.<br />
Soils that received chicken manure produced 199.7% and 531.9% more CO 2 than did controls<br />
from <strong>the</strong> 0–5- and 6–20-cm soil layers, respectively. Approximately, 32–64% of <strong>the</strong> total<br />
evolved CO 2 was released during <strong>the</strong> first 21 days after FOM addition. In soils that received leaf<br />
litter, both <strong>the</strong> 0–5- and 6–20-cm layers had total evolved CO 2 levels similar to those of <strong>the</strong><br />
controls. Thus, in contrast to chicken manure, leaf litter has negligible effects on CO 2 production<br />
when applied to soil. In <strong>the</strong> 0–5-cm layer, CO 2 evolution rate in <strong>the</strong> control was highest 0–3 days<br />
after FOM addition (Table 3). Beyond this period, CO 2 evolution rates were statistically lower<br />
until <strong>the</strong> end of incubation. CO 2 evolution rates were comparable during <strong>the</strong> 4–110-day periods.<br />
This is exactly <strong>the</strong> trend in <strong>the</strong> leaf litter-applied 0–5-cm layer. In <strong>the</strong> chicken manure-applied<br />
soils, CO 2 evolution rates significantly varied, and highest during <strong>the</strong> early stage of incubation<br />
(0–13 days after FOM addition), when rate was in <strong>the</strong> range 68.24 to 74.55 mg kg -1 day -1 .<br />
Starting from two weeks after FOM application, CO 2 evolution rate significantly dropped by<br />
more than half of <strong>the</strong> 4–13-day period level, decreasing with time until <strong>the</strong> end of incubation.<br />
From 14–110 days after FOM addition, evolution rates did not significantly differ.<br />
In <strong>the</strong> 0–5-cm layer without manure (control), CO 2 evolution rate was in <strong>the</strong> range 5.43 to 19.26<br />
mg kg -1 day -1 during <strong>the</strong> 0–44-day period, but from 4–110 days after FOM application, rates were<br />
134