

Visual Analytics - An Interaction of Sight and Thought - JMP
Visual Analytics - An Interaction of Sight and Thought - JMP
Visual Analytics - An Interaction of Sight and Thought - JMP

Create successful ePaper yourself
Turn your PDF publications into a flip-book with our unique Google optimized e-Paper software.
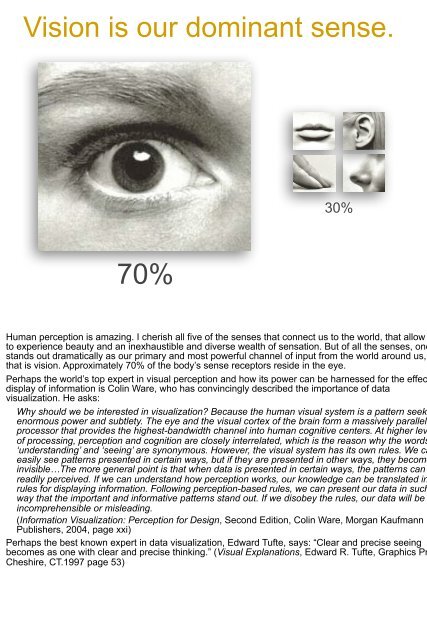
Vision is our dominant sense.<br />
30%<br />
70%<br />
Human perception is amazing. I cherish all five <strong>of</strong> the senses that connect us to the world, that allow<br />
to experience beauty <strong>and</strong> an inexhaustible <strong>and</strong> diverse wealth <strong>of</strong> sensation. But <strong>of</strong> all the senses, one<br />
st<strong>and</strong>s out dramatically as our primary <strong>and</strong> most powerful channel <strong>of</strong> input from the world around us,<br />
that is vision. Approximately 70% <strong>of</strong> the body’s sense receptors reside in the eye.<br />
Perhaps the world’s top expert in visual perception <strong>and</strong> how its power can be harnessed for the effec<br />
display <strong>of</strong> information is Colin Ware, who has convincingly described the importance <strong>of</strong> data<br />
visualization. He asks:<br />
Why should we be interested in visualization? Because the human visual system is a pattern seeke<br />
enormous power <strong>and</strong> subtlety. The eye <strong>and</strong> the visual cortex <strong>of</strong> the brain form a massively parallel<br />
processor that provides the highest-b<strong>and</strong>width channel into human cognitive centers. At higher lev<br />
<strong>of</strong> processing, perception <strong>and</strong> cognition are closely interrelated, which is the reason why the words<br />
‘underst<strong>and</strong>ing’ <strong>and</strong> ‘seeing’ are synonymous. However, the visual system has its own rules. We ca<br />
easily see patterns presented in certain ways, but if they are presented in other ways, they become<br />
invisible…The more general point is that when data is presented in certain ways, the patterns can<br />
readily perceived. If we can underst<strong>and</strong> how perception works, our knowledge can be translated in<br />
rules for displaying information. Following perception-based rules, we can present our data in such<br />
way that the important <strong>and</strong> informative patterns st<strong>and</strong> out. If we disobey the rules, our data will be<br />
incomprehensible or misleading.<br />
(Information <strong>Visual</strong>ization: Perception for Design, Second Edition, Colin Ware, Morgan Kaufmann<br />
Publishers, 2004, page xxi)<br />
Perhaps the best known expert in data visualization, Edward Tufte, says: “Clear <strong>and</strong> precise seeing<br />
becomes as one with clear <strong>and</strong> precise thinking.” (<strong>Visual</strong> Explanations, Edward R. Tufte, Graphics Pr<br />
Cheshire, CT.1997 page 53)


