

Visual Analytics - An Interaction of Sight and Thought - JMP
Visual Analytics - An Interaction of Sight and Thought - JMP
Visual Analytics - An Interaction of Sight and Thought - JMP

Create successful ePaper yourself
Turn your PDF publications into a flip-book with our unique Google optimized e-Paper software.
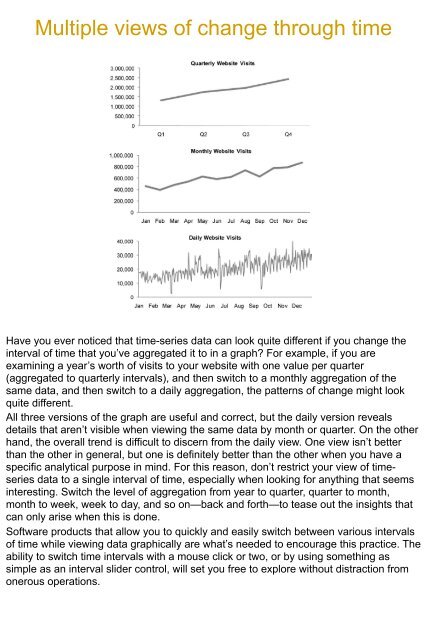
Multiple views <strong>of</strong> change through time<br />
Have you ever noticed that time-series data can look quite different if you change the<br />
interval <strong>of</strong> time that you’ve aggregated it to in a graph? For example, if you are<br />
examining a year’s worth <strong>of</strong> visits to your website with one value per quarter<br />
(aggregated to quarterly intervals), <strong>and</strong> then switch to a monthly aggregation <strong>of</strong> the<br />
same data, <strong>and</strong> then switch to a daily aggregation, the patterns <strong>of</strong> change might look<br />
quite different.<br />
All three versions <strong>of</strong> the graph are useful <strong>and</strong> correct, but the daily version reveals<br />
details that aren’t visible when viewing the same data by month or quarter. On the other<br />
h<strong>and</strong>, the overall trend is difficult to discern from the daily view. One view isn’t better<br />
than the other in general, but one is definitely better than the other when you have a<br />
specific analytical purpose in mind. For this reason, don’t restrict your view <strong>of</strong> timeseries<br />
data to a single interval <strong>of</strong> time, especially when looking for anything that seems<br />
interesting. Switch the level <strong>of</strong> aggregation from year to quarter, quarter to month,<br />
month to week, week to day, <strong>and</strong> so on—back <strong>and</strong> forth—to tease out the insights that<br />
can only arise when this is done.<br />
S<strong>of</strong>tware products that allow you to quickly <strong>and</strong> easily switch between various intervals<br />
<strong>of</strong> time while viewing data graphically are what’s needed to encourage this practice. The<br />
ability to switch time intervals with a mouse click or two, or by using something as<br />
simple as an interval slider control, will set you free to explore without distraction from<br />
onerous operations.


