

Visual Analytics - An Interaction of Sight and Thought - JMP
Visual Analytics - An Interaction of Sight and Thought - JMP
Visual Analytics - An Interaction of Sight and Thought - JMP

Create successful ePaper yourself
Turn your PDF publications into a flip-book with our unique Google optimized e-Paper software.
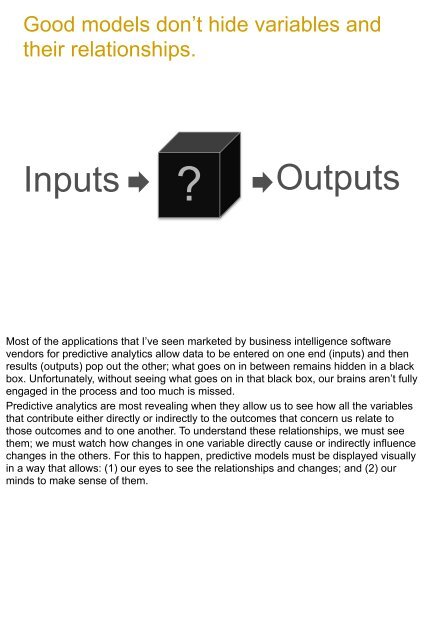
Good models don’t hide variables <strong>and</strong><br />
their relationships.<br />
Inputs<br />
?<br />
Outputs<br />
Most <strong>of</strong> the applications that I’ve seen marketed by business intelligence s<strong>of</strong>tware<br />
vendors for predictive analytics allow data to be entered on one end (inputs) <strong>and</strong> then<br />
results (outputs) pop out the other; what goes on in between remains hidden in a black<br />
box. Unfortunately, without seeing what goes on in that black box, our brains aren’t fully<br />
engaged in the process <strong>and</strong> too much is missed.<br />
Predictive analytics are most revealing when they allow us to see how all the variables<br />
that contribute either directly or indirectly to the outcomes that concern us relate to<br />
those outcomes <strong>and</strong> to one another. To underst<strong>and</strong> these relationships, we must see<br />
them; we must watch how changes in one variable directly cause or indirectly influence<br />
changes in the others. For this to happen, predictive models must be displayed visually<br />
in a way that allows: (1) our eyes to see the relationships <strong>and</strong> changes; <strong>and</strong> (2) our<br />
minds to make sense <strong>of</strong> them.


