

Visual Analytics - An Interaction of Sight and Thought - JMP
Visual Analytics - An Interaction of Sight and Thought - JMP
Visual Analytics - An Interaction of Sight and Thought - JMP

Create successful ePaper yourself
Turn your PDF publications into a flip-book with our unique Google optimized e-Paper software.
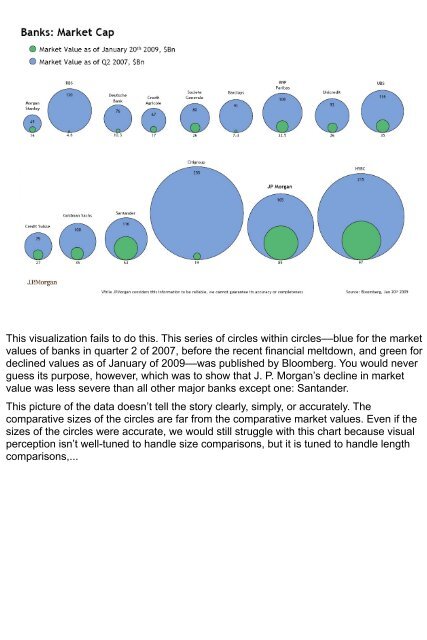
This visualization fails to do this. This series <strong>of</strong> circles within circles––blue for the market<br />
values <strong>of</strong> banks in quarter 2 <strong>of</strong> 2007, before the recent financial meltdown, <strong>and</strong> green for<br />
declined values as <strong>of</strong> January <strong>of</strong> 2009––was published by Bloomberg. You would never<br />
guess its purpose, however, which was to show that J. P. Morgan’s decline in market<br />
value was less severe than all other major banks except one: Sant<strong>and</strong>er.<br />
This picture <strong>of</strong> the data doesn’t tell the story clearly, simply, or accurately. The<br />
comparative sizes <strong>of</strong> the circles are far from the comparative market values. Even if the<br />
sizes <strong>of</strong> the circles were accurate, we would still struggle with this chart because visual<br />
perception isn’t well-tuned to h<strong>and</strong>le size comparisons, but it is tuned to h<strong>and</strong>le length<br />
comparisons,...


