Parameter setting - Knick
Parameter setting - Knick
Parameter setting - Knick

You also want an ePaper? Increase the reach of your titles
YUMPU automatically turns print PDFs into web optimized ePapers that Google loves.
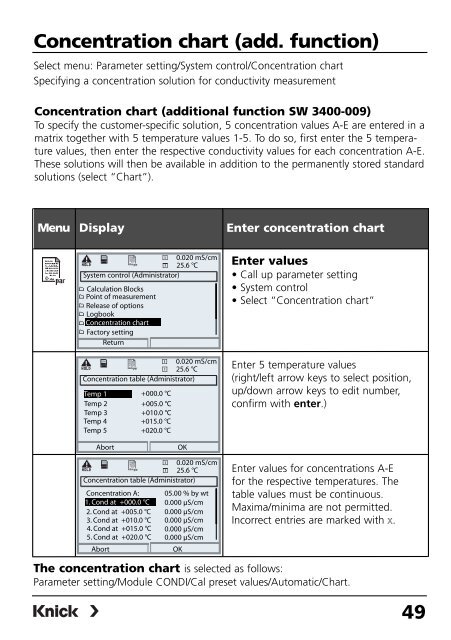
Concentration chart (add. function)<br />
Select menu: <strong>Parameter</strong> <strong>setting</strong>/System control/Concentration chart<br />
Specifying a concentration solution for conductivity measurement<br />
Concentration chart (additional function SW 3400-009)<br />
To specify the customer-specific solution, 5 concentration values A-E are entered in a<br />
matrix together with 5 temperature values 1-5. To do so, first enter the 5 temperature<br />
values, then enter the respective conductivity values for each concentration A-E.<br />
These solutions will then be available in addition to the permanently stored standard<br />
solutions (select “Chart”).<br />
Menu Display Enter concentration chart<br />
0.020 mS/cm<br />
25.6 °C<br />
System control (Administrator)<br />
Calculation Blocks<br />
Point of measurement<br />
Release of options<br />
Logbook<br />
Concentration chart<br />
Factory <strong>setting</strong><br />
Return<br />
0.020 mS/cm<br />
25.6 °C<br />
Concentration table (Administrator)<br />
Temp 1<br />
Temp 2<br />
Temp 3<br />
Temp 4<br />
Temp 5<br />
+000.0 °C<br />
+005.0 °C<br />
+010.0 °C<br />
+015.0 °C<br />
+020.0 °C<br />
Enter values<br />
• Call up parameter <strong>setting</strong><br />
• System control<br />
• Select “Concentration chart”<br />
Enter 5 temperature values<br />
(right/left arrow keys to select position,<br />
up/down arrow keys to edit number,<br />
confirm with enter.)<br />
Abort<br />
OK<br />
0.020 mS/cm<br />
25.6 °C<br />
Concentration table (Administrator)<br />
Concentration A:<br />
1. Cond at +000.0 °C<br />
2. Cond at +005.0 °C<br />
3. Cond at +010.0 °C<br />
4. Cond at +015.0 °C<br />
5. Cond at +020.0 °C<br />
Abort<br />
05.00 % by wt<br />
0.000 µS/cm<br />
0.000 µS/cm<br />
0.000 µS/cm<br />
0.000 µS/cm<br />
0.000 µS/cm<br />
OK<br />
Enter values for concentrations A-E<br />
for the respective temperatures. The<br />
table values must be continuous.<br />
Maxima/minima are not permitted.<br />
Incorrect entries are marked with x.<br />
The concentration chart is selected as follows:<br />
<strong>Parameter</strong> <strong>setting</strong>/Module CONDI/Cal preset values/Automatic/Chart.<br />
49