Report of Research, Field Investigation and Survey of Robert D ...
Report of Research, Field Investigation and Survey of Robert D ...
Report of Research, Field Investigation and Survey of Robert D ...

You also want an ePaper? Increase the reach of your titles
YUMPU automatically turns print PDFs into web optimized ePapers that Google loves.
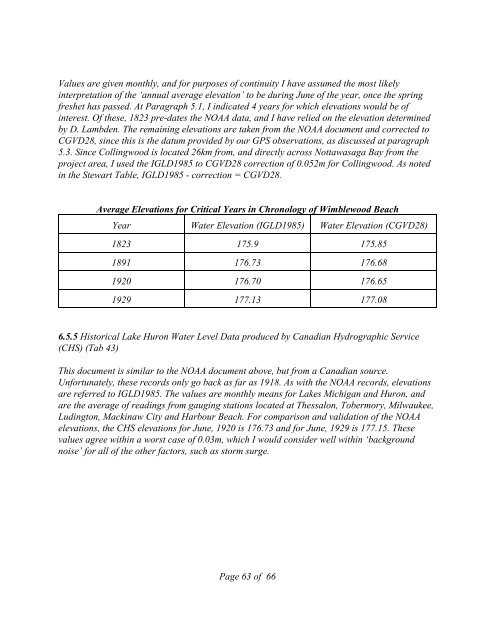
Values are given monthly, <strong>and</strong> for purposes <strong>of</strong> continuity I have assumed the most likely<br />
interpretation <strong>of</strong> the ‘annual average elevation’ to be during June <strong>of</strong> the year, once the spring<br />
freshet has passed. At Paragraph 5.1, I indicated 4 years for which elevations would be <strong>of</strong><br />
interest. Of these, 1823 pre-dates the NOAA data, <strong>and</strong> I have relied on the elevation determined<br />
by D. Lambden. The remaining elevations are taken from the NOAA document <strong>and</strong> corrected to<br />
CGVD28, since this is the datum provided by our GPS observations, as discussed at paragraph<br />
5.3. Since Collingwood is located 26km from, <strong>and</strong> directly across Nottawasaga Bay from the<br />
project area, I used the IGLD1985 to CGVD28 correction <strong>of</strong> 0.052m for Collingwood. As noted<br />
in the Stewart Table, IGLD1985 - correction = CGVD28.<br />
Average Elevations for Critical Years in Chronology <strong>of</strong> Wimblewood Beach<br />
Year Water Elevation (IGLD1985) Water Elevation (CGVD28)<br />
1823 175.9 175.85<br />
1891 176.73 176.68<br />
1920 176.70 176.65<br />
1929 177.13 177.08<br />
6.5.5 Historical Lake Huron Water Level Data produced by Canadian Hydrographic Service<br />
(CHS) (Tab 43)<br />
This document is similar to the NOAA document above, but from a Canadian source.<br />
Unfortunately, these records only go back as far as 1918. As with the NOAA records, elevations<br />
are referred to IGLD1985. The values are monthly means for Lakes Michigan <strong>and</strong> Huron, <strong>and</strong><br />
are the average <strong>of</strong> readings from gauging stations located at Thessalon, Tobermory, Milwaukee,<br />
Ludington, Mackinaw City <strong>and</strong> Harbour Beach. For comparison <strong>and</strong> validation <strong>of</strong> the NOAA<br />
elevations, the CHS elevations for June, 1920 is 176.73 <strong>and</strong> for June, 1929 is 177.15. These<br />
values agree within a worst case <strong>of</strong> 0.03m, which I would consider well within ‘background<br />
noise’ for all <strong>of</strong> the other factors, such as storm surge.<br />
Page 63 <strong>of</strong> 66