The Status of Arts Education in Ohio's Public ... - Ohio Arts Council
The Status of Arts Education in Ohio's Public ... - Ohio Arts Council
The Status of Arts Education in Ohio's Public ... - Ohio Arts Council

Create successful ePaper yourself
Turn your PDF publications into a flip-book with our unique Google optimized e-Paper software.
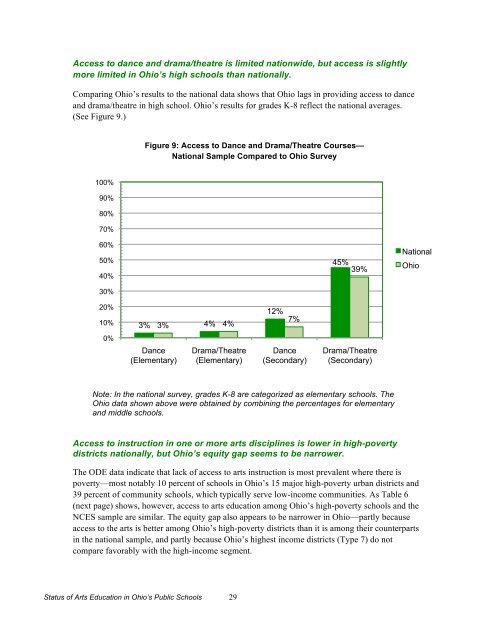
Access to dance and drama/theatre is limited nationwide, but access is slightly<br />
more limited <strong>in</strong> <strong>Ohio</strong>’s high schools than nationally.<br />
Compar<strong>in</strong>g <strong>Ohio</strong>’s results to the national data shows that <strong>Ohio</strong> lags <strong>in</strong> provid<strong>in</strong>g access to dance<br />
and drama/theatre <strong>in</strong> high school. <strong>Ohio</strong>’s results for grades K-8 reflect the national averages.<br />
(See Figure 9.)<br />
Figure 9: Access to Dance and Drama/<strong>The</strong>atre Courses—<br />
National Sample Compared to <strong>Ohio</strong> Survey<br />
100%<br />
90%<br />
80%<br />
70%<br />
60%<br />
50%<br />
40%<br />
30%<br />
45%<br />
39%<br />
National<br />
<strong>Ohio</strong><br />
20%<br />
10%<br />
3% 3% 4% 4%<br />
12%<br />
7%<br />
0%<br />
Dance<br />
(Elementary)<br />
Drama/<strong>The</strong>atre<br />
(Elementary)<br />
Dance<br />
(Secondary)<br />
Drama/<strong>The</strong>atre<br />
(Secondary)<br />
Note: In the national survey, grades K-8 are categorized as elementary schools. <strong>The</strong><br />
<strong>Ohio</strong> data shown above were obta<strong>in</strong>ed by comb<strong>in</strong><strong>in</strong>g the percentages for elementary<br />
and middle schools.<br />
Access to <strong>in</strong>struction <strong>in</strong> one or more arts discipl<strong>in</strong>es is lower <strong>in</strong> high-poverty<br />
districts nationally, but <strong>Ohio</strong>’s equity gap seems to be narrower.<br />
<strong>The</strong> ODE data <strong>in</strong>dicate that lack <strong>of</strong> access to arts <strong>in</strong>struction is most prevalent where there is<br />
poverty—most notably 10 percent <strong>of</strong> schools <strong>in</strong> <strong>Ohio</strong>’s 15 major high-poverty urban districts and<br />
39 percent <strong>of</strong> community schools, which typically serve low-<strong>in</strong>come communities. As Table 6<br />
(next page) shows, however, access to arts education among <strong>Ohio</strong>’s high-poverty schools and the<br />
NCES sample are similar. <strong>The</strong> equity gap also appears to be narrower <strong>in</strong> <strong>Ohio</strong>—partly because<br />
access to the arts is better among <strong>Ohio</strong>’s high-poverty districts than it is among their counterparts<br />
<strong>in</strong> the national sample, and partly because <strong>Ohio</strong>’s highest <strong>in</strong>come districts (Type 7) do not<br />
compare favorably with the high-<strong>in</strong>come segment.<br />
<strong>Status</strong> <strong>of</strong> <strong>Arts</strong> <strong>Education</strong> <strong>in</strong> <strong>Ohio</strong>’s <strong>Public</strong> Schools 29