Accommodating High Levels of Variable Generation - NERC
Accommodating High Levels of Variable Generation - NERC
Accommodating High Levels of Variable Generation - NERC

Create successful ePaper yourself
Turn your PDF publications into a flip-book with our unique Google optimized e-Paper software.
Introduction<br />
1. Introduction<br />
Fossil-fired generation produced nearly 70% <strong>of</strong> the total electrical energy in the United States in<br />
2006, with nuclear producing 19% and existing renewable generation approximately 8%. 1<br />
Natural gas-fired generation produced 21% <strong>of</strong> the electrical energy while representing 41% <strong>of</strong><br />
the installed summer generating capacity. Coal-fired generation produced 49% <strong>of</strong> the electrical<br />
energy in North America and represented 32% <strong>of</strong> the installed summer capacity. Heavy and<br />
light oil is primarily used as a back-up fuel for natural gas. Oil-fired capacity is negligible and<br />
total oil generation comprised less than 2% <strong>of</strong> the electrical energy produced in 2006. 2 Fossil<br />
fuels are non-renewable: that is, they draw on finite resources. In addition, they contribute to<br />
the production <strong>of</strong> greenhouse gases and particulates. In contrast, renewable energy resources,<br />
such as wind, solar, ocean, biomass, hydro, etc., can be replenished at a generally predictable rate<br />
and have no direct greenhouse gas or particulate emissions.<br />
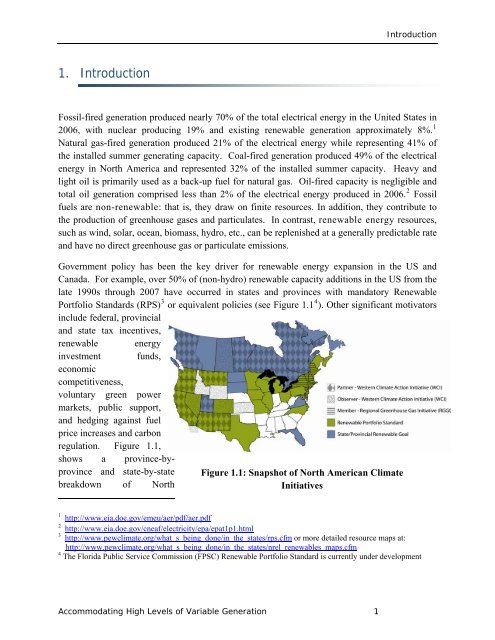
Government policy has been the key driver for renewable energy expansion in the US and<br />
Canada. For example, over 50% <strong>of</strong> (non-hydro) renewable capacity additions in the US from the<br />
late 1990s through 2007 have occurred in states and provinces with mandatory Renewable<br />
Portfolio Standards (RPS) 3 or equivalent policies (see Figure 1.1 4 ). Other significant motivators<br />
include federal, provincial<br />
and state tax incentives,<br />
renewable energy<br />
investment funds,<br />
economic<br />
competitiveness,<br />
voluntary green power<br />
markets, public support,<br />
and hedging against fuel<br />
price increases and carbon<br />
regulation. Figure 1.1,<br />
shows a province-byprovince<br />
and state-by-state<br />
breakdown <strong>of</strong> North<br />
Figure 1.1: Snapshot <strong>of</strong> North American Climate<br />
Initiatives<br />
1 http://www.eia.doe.gov/emeu/aer/pdf/aer.pdf<br />
2 http://www.eia.doe.gov/cneaf/electricity/epa/epat1p1.html<br />
3 http://www.pewclimate.org/what_s_being_done/in_the_states/rps.cfm or more detailed resource maps at:<br />
http://www.pewclimate.org/what_s_being_done/in_the_states/nrel_renewables_maps.cfm<br />
4 The Florida Public Service Commission (FPSC) Renewable Portfolio Standard is currently under development<br />
<strong>Accommodating</strong> <strong>High</strong> <strong>Levels</strong> <strong>of</strong> <strong>Variable</strong> <strong>Generation</strong> 1