

Attachment tables only (PDF - 363 Kb)
Attachment tables only (PDF - 363 Kb)
Attachment tables only (PDF - 363 Kb)

You also want an ePaper? Increase the reach of your titles
YUMPU automatically turns print PDFs into web optimized ePapers that Google loves.
Table 13A.61<br />
Table 13A.61<br />
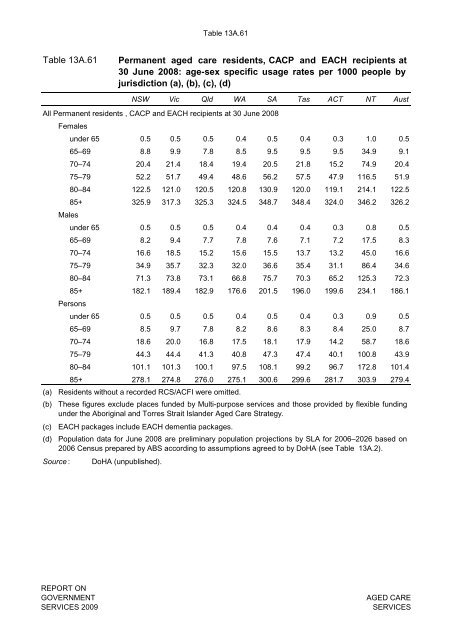
Permanent aged care residents, CACP and EACH recipients at<br />
30 June 2008: age-sex specific usage rates per 1000 people by<br />
jurisdiction (a), (b), (c), (d)<br />
NSW Vic Qld WA SA Tas ACT NT Aust<br />
All Permanent residents , CACP and EACH recipients at 30 June 2008<br />
Females<br />
under 65 0.5 0.5 0.5 0.4 0.5 0.4 0.3 1.0 0.5<br />
65–69 8.8 9.9 7.8 8.5 9.5 9.5 9.5 34.9 9.1<br />
70–74 20.4 21.4 18.4 19.4 20.5 21.8 15.2 74.9 20.4<br />
75–79 52.2 51.7 49.4 48.6 56.2 57.5 47.9 116.5 51.9<br />
80–84 122.5 121.0 120.5 120.8 130.9 120.0 119.1 214.1 122.5<br />
85+ 325.9 317.3 325.3 324.5 348.7 348.4 324.0 346.2 326.2<br />
Males<br />
under 65 0.5 0.5 0.5 0.4 0.4 0.4 0.3 0.8 0.5<br />
65–69 8.2 9.4 7.7 7.8 7.6 7.1 7.2 17.5 8.3<br />
70–74 16.6 18.5 15.2 15.6 15.5 13.7 13.2 45.0 16.6<br />
75–79 34.9 35.7 32.3 32.0 36.6 35.4 31.1 86.4 34.6<br />
80–84 71.3 73.8 73.1 66.8 75.7 70.3 65.2 125.3 72.3<br />
85+ 182.1 189.4 182.9 176.6 201.5 196.0 199.6 234.1 186.1<br />
Persons<br />
under 65 0.5 0.5 0.5 0.4 0.5 0.4 0.3 0.9 0.5<br />
65–69 8.5 9.7 7.8 8.2 8.6 8.3 8.4 25.0 8.7<br />
70–74 18.6 20.0 16.8 17.5 18.1 17.9 14.2 58.7 18.6<br />
75–79 44.3 44.4 41.3 40.8 47.3 47.4 40.1 100.8 43.9<br />
80–84 101.1 101.3 100.1 97.5 108.1 99.2 96.7 172.8 101.4<br />
85+ 278.1 274.8 276.0 275.1 300.6 299.6 281.7 303.9 279.4<br />
(a) Residents without a recorded RCS/ACFI were omitted.<br />
(b) These figures exclude places funded by Multi-purpose services and those provided by flexible funding<br />
under the Aboriginal and Torres Strait Islander Aged Care Strategy.<br />
(c) EACH packages include EACH dementia packages.<br />
(d) Population data for June 2008 are preliminary population projections by SLA for 2006–2026 based on<br />
2006 Census prepared by ABS according to assumptions agreed to by DoHA (see Table 13A.2).<br />
Source : DoHA (unpublished).<br />
REPORT ON<br />
GOVERNMENT<br />
SERVICES 2009<br />
AGED CARE<br />
SERVICES


