

Attachment tables only (PDF - 363 Kb)
Attachment tables only (PDF - 363 Kb)
Attachment tables only (PDF - 363 Kb)

You also want an ePaper? Increase the reach of your titles
YUMPU automatically turns print PDFs into web optimized ePapers that Google loves.
Table 13A.10<br />
Table 13A.10<br />
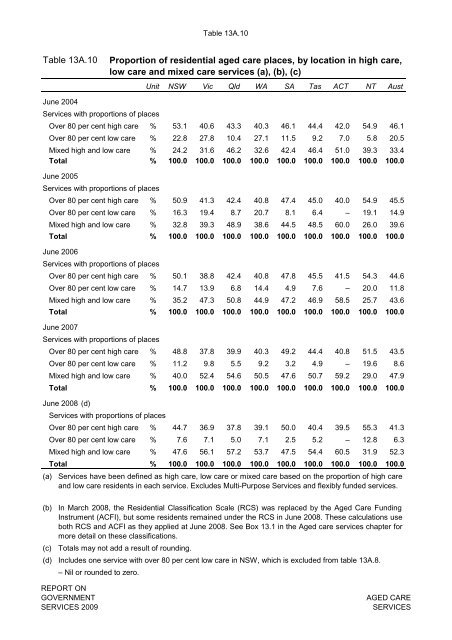
Proportion of residential aged care places, by location in high care,<br />
low care and mixed care services (a), (b), (c)<br />
Unit NSW Vic Qld WA SA Tas ACT NT Aust<br />
June 2004<br />
Services with proportions of places<br />
Over 80 per cent high care % 53.1 40.6 43.3 40.3 46.1 44.4 42.0 54.9 46.1<br />
Over 80 per cent low care % 22.8 27.8 10.4 27.1 11.5 9.2 7.0 5.8 20.5<br />
Mixed high and low care % 24.2 31.6 46.2 32.6 42.4 46.4 51.0 39.3 33.4<br />
Total % 100.0 100.0 100.0 100.0 100.0 100.0 100.0 100.0 100.0<br />
June 2005<br />
Services with proportions of places<br />
Over 80 per cent high care % 50.9 41.3 42.4 40.8 47.4 45.0 40.0 54.9 45.5<br />
Over 80 per cent low care % 16.3 19.4 8.7 20.7 8.1 6.4 – 19.1 14.9<br />
Mixed high and low care % 32.8 39.3 48.9 38.6 44.5 48.5 60.0 26.0 39.6<br />
Total % 100.0 100.0 100.0 100.0 100.0 100.0 100.0 100.0 100.0<br />
June 2006<br />
Services with proportions of places<br />
Over 80 per cent high care % 50.1 38.8 42.4 40.8 47.8 45.5 41.5 54.3 44.6<br />
Over 80 per cent low care % 14.7 13.9 6.8 14.4 4.9 7.6 – 20.0 11.8<br />
Mixed high and low care % 35.2 47.3 50.8 44.9 47.2 46.9 58.5 25.7 43.6<br />
Total % 100.0 100.0 100.0 100.0 100.0 100.0 100.0 100.0 100.0<br />
June 2007<br />
Services with proportions of places<br />
Over 80 per cent high care % 48.8 37.8 39.9 40.3 49.2 44.4 40.8 51.5 43.5<br />
Over 80 per cent low care % 11.2 9.8 5.5 9.2 3.2 4.9 – 19.6 8.6<br />
Mixed high and low care % 40.0 52.4 54.6 50.5 47.6 50.7 59.2 29.0 47.9<br />
Total % 100.0 100.0 100.0 100.0 100.0 100.0 100.0 100.0 100.0<br />
June 2008 (d)<br />
Services with proportions of places<br />
Over 80 per cent high care % 44.7 36.9 37.8 39.1 50.0 40.4 39.5 55.3 41.3<br />
Over 80 per cent low care % 7.6 7.1 5.0 7.1 2.5 5.2 – 12.8 6.3<br />
Mixed high and low care % 47.6 56.1 57.2 53.7 47.5 54.4 60.5 31.9 52.3<br />
Total % 100.0 100.0 100.0 100.0 100.0 100.0 100.0 100.0 100.0<br />
(a) Services have been defined as high care, low care or mixed care based on the proportion of high care<br />
and low care residents in each service. Excludes Multi-Purpose Services and flexibly funded services.<br />
(b)<br />
(c)<br />
(d)<br />
In March 2008, the Residential Classification Scale (RCS) was replaced by the Aged Care Funding<br />
Instrument (ACFI), but some residents remained under the RCS in June 2008. These calculations use<br />
both RCS and ACFI as they applied at June 2008. See Box 13.1 in the Aged care services chapter for<br />
more detail on these classifications.<br />
Totals may not add a result of rounding.<br />
Includes one service with over 80 per cent low care in NSW, which is excluded from table 13A.8.<br />
– Nil or rounded to zero.<br />
REPORT ON<br />
GOVERNMENT<br />
SERVICES 2009<br />
AGED CARE<br />
SERVICES


