

Attachment tables only (PDF - 363 Kb)
Attachment tables only (PDF - 363 Kb)
Attachment tables only (PDF - 363 Kb)

Create successful ePaper yourself
Turn your PDF publications into a flip-book with our unique Google optimized e-Paper software.
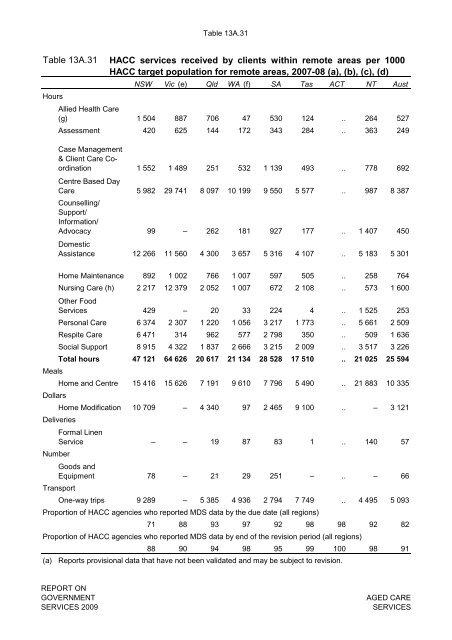
Table 13A.31<br />
Table 13A.31<br />
Hours<br />
Allied Health Care<br />
(g)<br />
Assessment<br />
HACC services received by clients within remote areas per 1000<br />
HACC target population for remote areas, 2007-08 (a), (b), (c), (d)<br />
NSW Vic (e) Qld WA (f) SA Tas ACT NT Aust<br />
1 504 887 706 47 530 124 .. 264 527<br />
420 625 144 172 343 284 .. <strong>363</strong> 249<br />
Case Management<br />
& Client Care Coordination<br />
Centre Based Day<br />
Care<br />
Counselling/<br />
Support/<br />
Information/<br />
Advocacy<br />
Domestic<br />
Assistance<br />
1 552 1 489 251 532 1 139 493 .. 778 692<br />
5 982 29 741 8 097 10 199 9 550 5 577 .. 987 8 387<br />
99 – 262 181 927 177 .. 1 407 450<br />
12 266 11 560 4 300 3 657 5 316 4 107 .. 5 183 5 301<br />
Home Maintenance 892 1 002 766 1 007 597 505 .. 258 764<br />
Nursing Care (h) 2 217 12 379 2 052 1 007 672 2 108 .. 573 1 600<br />
Other Food<br />
Services<br />
429 – 20 33 224 4 .. 1 525 253<br />
Personal Care 6 374 2 307 1 220 1 056 3 217 1 773 .. 5 661 2 509<br />
Respite Care 6 471 314 962 577 2 798 350 .. 509 1 636<br />
Social Support 8 915 4 322 1 837 2 666 3 215 2 009 .. 3 517 3 226<br />
Total hours 47 121 64 626 20 617 21 134 28 528 17 510 .. 21 025 25 594<br />
Meals<br />
Home and Centre 15 416 15 626 7 191 9 610 7 796 5 490 .. 21 883 10 335<br />
Dollars<br />
Home Modification 10 709 – 4 340 97 2 465 9 100 .. – 3 121<br />
Deliveries<br />
Formal Linen<br />
Service<br />
– – 19 87 83 1 .. 140 57<br />
Number<br />
Goods and<br />
Equipment<br />
78 – 21 29 251 – .. – 66<br />
Transport<br />
One-way trips 9 289 – 5 385 4 936 2 794 7 749 .. 4 495 5 093<br />
Proportion of HACC agencies who reported MDS data by the due date (all regions)<br />
71 88 93 97 92 98 98 92 82<br />
Proportion of HACC agencies who reported MDS data by end of the revision period (all regions)<br />
88 90 94 98 95 99 100 98 91<br />
(a) Reports provisional data that have not been validated and may be subject to revision.<br />
REPORT ON<br />
GOVERNMENT<br />
SERVICES 2009<br />
AGED CARE<br />
SERVICES


