

Attachment tables only (PDF - 363 Kb)
Attachment tables only (PDF - 363 Kb)
Attachment tables only (PDF - 363 Kb)

You also want an ePaper? Increase the reach of your titles
YUMPU automatically turns print PDFs into web optimized ePapers that Google loves.
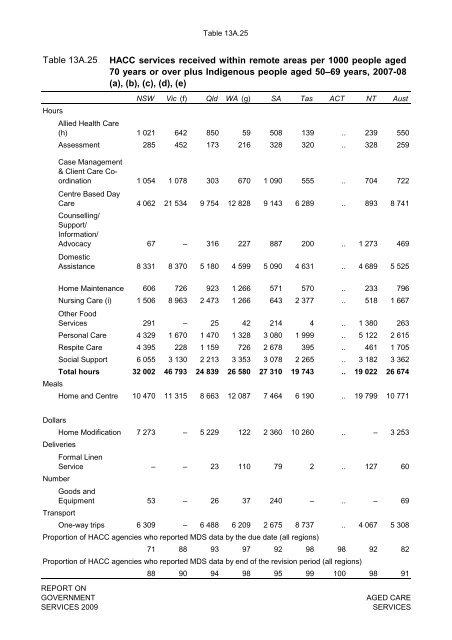
Table 13A.25<br />
Table 13A.25<br />
Hours<br />
Allied Health Care<br />
(h)<br />
Assessment<br />
HACC services received within remote areas per 1000 people aged<br />
70 years or over plus Indigenous people aged 50–69 years, 2007-08<br />
(a), (b), (c), (d), (e)<br />
NSW Vic (f) Qld WA (g) SA Tas ACT NT Aust<br />
1 021 642 850 59 508 139 .. 239 550<br />
285 452 173 216 328 320 .. 328 259<br />
Case Management<br />
& Client Care Coordination<br />
Centre Based Day<br />
Care<br />
Counselling/<br />
Support/<br />
Information/<br />
Advocacy<br />
Domestic<br />
Assistance<br />
1 054 1 078 303 670 1 090 555 .. 704 722<br />
4 062 21 534 9 754 12 828 9 143 6 289 .. 893 8 741<br />
67 – 316 227 887 200 .. 1 273 469<br />
8 331 8 370 5 180 4 599 5 090 4 631 .. 4 689 5 525<br />
Home Maintenance 606 726 923 1 266 571 570 .. 233 796<br />
Nursing Care (i) 1 506 8 963 2 473 1 266 643 2 377 .. 518 1 667<br />
Other Food<br />
Services<br />
291 – 25 42 214 4 .. 1 380 263<br />
Personal Care 4 329 1 670 1 470 1 328 3 080 1 999 .. 5 122 2 615<br />
Respite Care 4 395 228 1 159 726 2 678 395 .. 461 1 705<br />
Social Support 6 055 3 130 2 213 3 353 3 078 2 265 .. 3 182 3 362<br />
Total hours 32 002 46 793 24 839 26 580 27 310 19 743 .. 19 022 26 674<br />
Meals<br />
Home and Centre 10 470 11 315 8 663 12 087 7 464 6 190 .. 19 799 10 771<br />
Dollars<br />
Home Modification 7 273 – 5 229 122 2 360 10 260 .. – 3 253<br />
Deliveries<br />
Formal Linen<br />
Service<br />
– – 23 110 79 2 .. 127 60<br />
Number<br />
Goods and<br />
Equipment<br />
53 – 26 37 240 – .. – 69<br />
Transport<br />
One-way trips 6 309 – 6 488 6 209 2 675 8 737 .. 4 067 5 308<br />
Proportion of HACC agencies who reported MDS data by the due date (all regions)<br />
71 88 93 97 92 98 98 92 82<br />
Proportion of HACC agencies who reported MDS data by end of the revision period (all regions)<br />
88 90 94 98 95 99 100 98 91<br />
REPORT ON<br />
GOVERNMENT<br />
SERVICES 2009<br />
AGED CARE<br />
SERVICES


