

Attachment tables only (PDF - 363 Kb)
Attachment tables only (PDF - 363 Kb)
Attachment tables only (PDF - 363 Kb)

You also want an ePaper? Increase the reach of your titles
YUMPU automatically turns print PDFs into web optimized ePapers that Google loves.
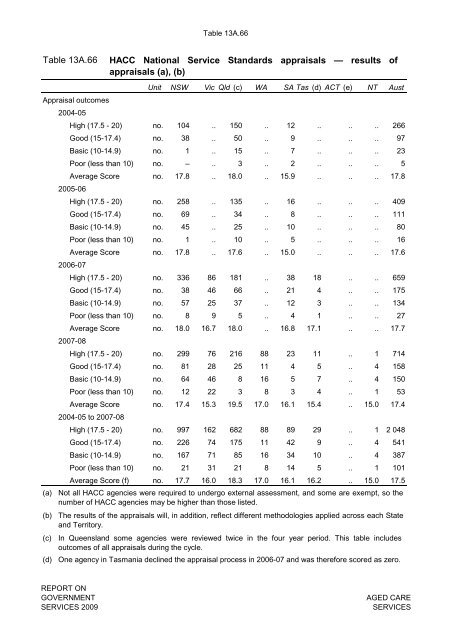
Table 13A.66<br />
Table 13A.66<br />
HACC National Service Standards appraisals — results of<br />
appraisals (a), (b)<br />
Unit NSW Vic Qld (c) WA SA Tas (d) ACT (e) NT Aust<br />
Appraisal outcomes<br />
2004-05<br />
High (17.5 - 20) no. 104 .. 150 .. 12 .. .. .. 266<br />
Good (15-17.4) no. 38 .. 50 .. 9 .. .. .. 97<br />
Basic (10-14.9) no. 1 .. 15 .. 7 .. .. .. 23<br />
Poor (less than 10) no. – .. 3 .. 2 .. .. .. 5<br />
Average Score no. 17.8 .. 18.0 .. 15.9 .. .. .. 17.8<br />
2005-06<br />
High (17.5 - 20) no. 258 .. 135 .. 16 .. .. .. 409<br />
Good (15-17.4) no. 69 .. 34 .. 8 .. .. .. 111<br />
Basic (10-14.9) no. 45 .. 25 .. 10 .. .. .. 80<br />
Poor (less than 10) no. 1 .. 10 .. 5 .. .. .. 16<br />
Average Score no. 17.8 .. 17.6 .. 15.0 .. .. .. 17.6<br />
2006-07<br />
High (17.5 - 20) no. 336 86 181 .. 38 18 .. .. 659<br />
Good (15-17.4) no. 38 46 66 .. 21 4 .. .. 175<br />
Basic (10-14.9) no. 57 25 37 .. 12 3 .. .. 134<br />
Poor (less than 10) no. 8 9 5 .. 4 1 .. .. 27<br />
Average Score no. 18.0 16.7 18.0 .. 16.8 17.1 .. .. 17.7<br />
2007-08<br />
High (17.5 - 20) no. 299 76 216 88 23 11 .. 1 714<br />
Good (15-17.4) no. 81 28 25 11 4 5 .. 4 158<br />
Basic (10-14.9) no. 64 46 8 16 5 7 .. 4 150<br />
Poor (less than 10) no. 12 22 3 8 3 4 .. 1 53<br />
Average Score no. 17.4 15.3 19.5 17.0 16.1 15.4 .. 15.0 17.4<br />
2004-05 to 2007-08<br />
High (17.5 - 20) no. 997 162 682 88 89 29 .. 1 2 048<br />
Good (15-17.4) no. 226 74 175 11 42 9 .. 4 541<br />
Basic (10-14.9) no. 167 71 85 16 34 10 .. 4 387<br />
Poor (less than 10) no. 21 31 21 8 14 5 .. 1 101<br />
Average Score (f) no. 17.7 16.0 18.3 17.0 16.1 16.2 .. 15.0 17.5<br />
(a) Not all HACC agencies were required to undergo external assessment, and some are exempt, so the<br />
number of HACC agencies may be higher than those listed.<br />
(b) The results of the appraisals will, in addition, reflect different methodologies applied across each State<br />
and Territory.<br />
(c) In Queensland some agencies were reviewed twice in the four year period. This table includes<br />
outcomes of all appraisals during the cycle.<br />
(d) One agency in Tasmania declined the appraisal process in 2006-07 and was therefore scored as zero.<br />
REPORT ON<br />
GOVERNMENT<br />
SERVICES 2009<br />
AGED CARE<br />
SERVICES


