

Attachment tables only (PDF - 363 Kb)
Attachment tables only (PDF - 363 Kb)
Attachment tables only (PDF - 363 Kb)

Create successful ePaper yourself
Turn your PDF publications into a flip-book with our unique Google optimized e-Paper software.
Table 13A.62<br />
Table 13A.62<br />
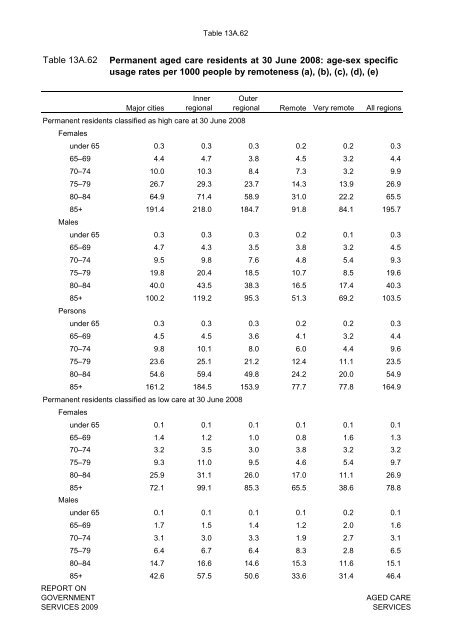
Permanent aged care residents at 30 June 2008: age-sex specific<br />
usage rates per 1000 people by remoteness (a), (b), (c), (d), (e)<br />
Major cities<br />
Inner<br />
regional<br />
Outer<br />
regional Remote Very remote All regions<br />
Permanent residents classified as high care at 30 June 2008<br />
Females<br />
under 65 0.3 0.3 0.3 0.2 0.2 0.3<br />
65–69 4.4 4.7 3.8 4.5 3.2 4.4<br />
70–74 10.0 10.3 8.4 7.3 3.2 9.9<br />
75–79 26.7 29.3 23.7 14.3 13.9 26.9<br />
80–84 64.9 71.4 58.9 31.0 22.2 65.5<br />
85+ 191.4 218.0 184.7 91.8 84.1 195.7<br />
Males<br />
under 65 0.3 0.3 0.3 0.2 0.1 0.3<br />
65–69 4.7 4.3 3.5 3.8 3.2 4.5<br />
70–74 9.5 9.8 7.6 4.8 5.4 9.3<br />
75–79 19.8 20.4 18.5 10.7 8.5 19.6<br />
80–84 40.0 43.5 38.3 16.5 17.4 40.3<br />
85+ 100.2 119.2 95.3 51.3 69.2 103.5<br />
Persons<br />
under 65 0.3 0.3 0.3 0.2 0.2 0.3<br />
65–69 4.5 4.5 3.6 4.1 3.2 4.4<br />
70–74 9.8 10.1 8.0 6.0 4.4 9.6<br />
75–79 23.6 25.1 21.2 12.4 11.1 23.5<br />
80–84 54.6 59.4 49.8 24.2 20.0 54.9<br />
85+ 161.2 184.5 153.9 77.7 77.8 164.9<br />
Permanent residents classified as low care at 30 June 2008<br />
Females<br />
under 65 0.1 0.1 0.1 0.1 0.1 0.1<br />
65–69 1.4 1.2 1.0 0.8 1.6 1.3<br />
70–74 3.2 3.5 3.0 3.8 3.2 3.2<br />
75–79 9.3 11.0 9.5 4.6 5.4 9.7<br />
80–84 25.9 31.1 26.0 17.0 11.1 26.9<br />
85+ 72.1 99.1 85.3 65.5 38.6 78.8<br />
Males<br />
under 65 0.1 0.1 0.1 0.1 0.2 0.1<br />
65–69 1.7 1.5 1.4 1.2 2.0 1.6<br />
70–74 3.1 3.0 3.3 1.9 2.7 3.1<br />
75–79 6.4 6.7 6.4 8.3 2.8 6.5<br />
80–84 14.7 16.6 14.6 15.3 11.6 15.1<br />
85+ 42.6 57.5 50.6 33.6 31.4 46.4<br />
REPORT ON<br />
GOVERNMENT<br />
SERVICES 2009<br />
AGED CARE<br />
SERVICES


