

Attachment tables only (PDF - 363 Kb)
Attachment tables only (PDF - 363 Kb)
Attachment tables only (PDF - 363 Kb)

Create successful ePaper yourself
Turn your PDF publications into a flip-book with our unique Google optimized e-Paper software.
Table 13A.5<br />
Table 13A.5<br />
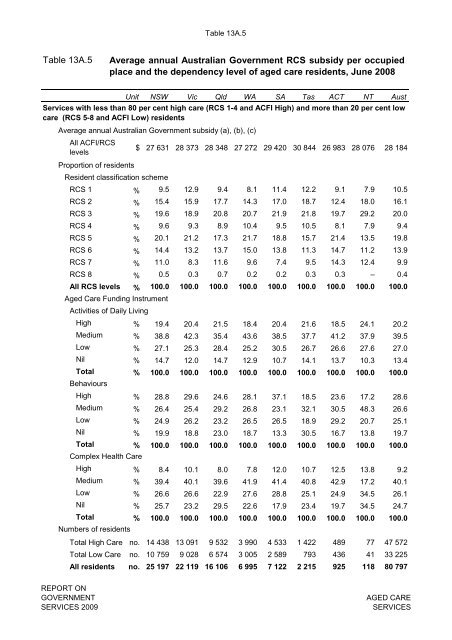
Average annual Australian Government RCS subsidy per occupied<br />
place and the dependency level of aged care residents, June 2008<br />
Unit NSW Vic Qld WA SA Tas ACT NT Aust<br />
Services with less than 80 per cent high care (RCS 1-4 and ACFI High) and more than 20 per cent low<br />
care (RCS 5-8 and ACFI Low) residents<br />
Average annual Australian Government subsidy (a), (b), (c)<br />
All ACFI/RCS<br />
levels<br />
$ 27 631 28 373 28 348 27 272 29 420 30 844 26 983 28 076 28 184<br />
Proportion of residents<br />
Resident classification scheme<br />
RCS 1 % 9.5 12.9 9.4 8.1 11.4 12.2 9.1 7.9 10.5<br />
RCS 2 % 15.4 15.9 17.7 14.3 17.0 18.7 12.4 18.0 16.1<br />
RCS 3 % 19.6 18.9 20.8 20.7 21.9 21.8 19.7 29.2 20.0<br />
RCS 4 % 9.6 9.3 8.9 10.4 9.5 10.5 8.1 7.9 9.4<br />
RCS 5 % 20.1 21.2 17.3 21.7 18.8 15.7 21.4 13.5 19.8<br />
RCS 6 % 14.4 13.2 13.7 15.0 13.8 11.3 14.7 11.2 13.9<br />
RCS 7 % 11.0 8.3 11.6 9.6 7.4 9.5 14.3 12.4 9.9<br />
RCS 8 % 0.5 0.3 0.7 0.2 0.2 0.3 0.3 – 0.4<br />
All RCS levels % 100.0 100.0 100.0 100.0 100.0 100.0 100.0 100.0 100.0<br />
Aged Care Funding Instrument<br />
Activities of Daily Living<br />
High % 19.4 20.4 21.5 18.4 20.4 21.6 18.5 24.1 20.2<br />
Medium % 38.8 42.3 35.4 43.6 38.5 37.7 41.2 37.9 39.5<br />
Low % 27.1 25.3 28.4 25.2 30.5 26.7 26.6 27.6 27.0<br />
Nil % 14.7 12.0 14.7 12.9 10.7 14.1 13.7 10.3 13.4<br />
Total % 100.0 100.0 100.0 100.0 100.0 100.0 100.0 100.0 100.0<br />
Behaviours<br />
High % 28.8 29.6 24.6 28.1 37.1 18.5 23.6 17.2 28.6<br />
Medium % 26.4 25.4 29.2 26.8 23.1 32.1 30.5 48.3 26.6<br />
Low % 24.9 26.2 23.2 26.5 26.5 18.9 29.2 20.7 25.1<br />
Nil % 19.9 18.8 23.0 18.7 13.3 30.5 16.7 13.8 19.7<br />
Total % 100.0 100.0 100.0 100.0 100.0 100.0 100.0 100.0 100.0<br />
Complex Health Care<br />
High % 8.4 10.1 8.0 7.8 12.0 10.7 12.5 13.8 9.2<br />
Medium % 39.4 40.1 39.6 41.9 41.4 40.8 42.9 17.2 40.1<br />
Low % 26.6 26.6 22.9 27.6 28.8 25.1 24.9 34.5 26.1<br />
Nil % 25.7 23.2 29.5 22.6 17.9 23.4 19.7 34.5 24.7<br />
Total % 100.0 100.0 100.0 100.0 100.0 100.0 100.0 100.0 100.0<br />
Numbers of residents<br />
Total High Care no. 14 438 13 091 9 532 3 990 4 533 1 422 489 77 47 572<br />
Total Low Care no. 10 759 9 028 6 574 3 005 2 589 793 436 41 33 225<br />
All residents no. 25 197 22 119 16 106 6 995 7 122 2 215 925 118 80 797<br />
REPORT ON<br />
GOVERNMENT<br />
SERVICES 2009<br />
AGED CARE<br />
SERVICES


