

Attachment tables only (PDF - 363 Kb)
Attachment tables only (PDF - 363 Kb)
Attachment tables only (PDF - 363 Kb)

You also want an ePaper? Increase the reach of your titles
YUMPU automatically turns print PDFs into web optimized ePapers that Google loves.
Table 13A.13<br />
Table 13A.13<br />
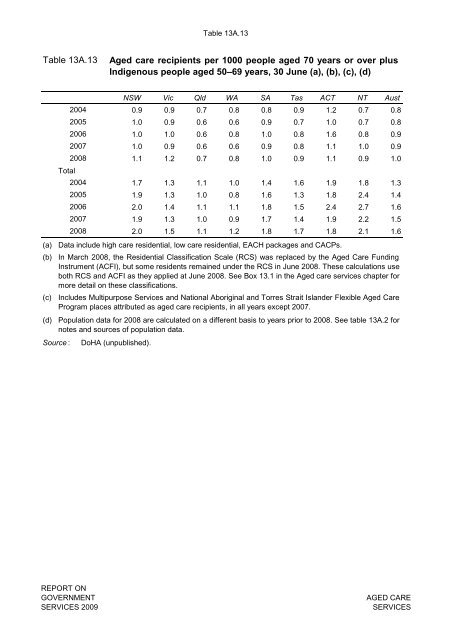
Aged care recipients per 1000 people aged 70 years or over plus<br />
Indigenous people aged 50–69 years, 30 June (a), (b), (c), (d)<br />
(a)<br />
(b)<br />
2004<br />
2005<br />
2006<br />
2007<br />
2008<br />
Total<br />
2004<br />
2005<br />
2006<br />
2007<br />
2008<br />
NSW Vic Qld WA SA Tas ACT NT Aust<br />
0.9 0.9 0.7 0.8 0.8 0.9 1.2 0.7 0.8<br />
1.0 0.9 0.6 0.6 0.9 0.7 1.0 0.7 0.8<br />
1.0 1.0 0.6 0.8 1.0 0.8 1.6 0.8 0.9<br />
1.0 0.9 0.6 0.6 0.9 0.8 1.1 1.0 0.9<br />
1.1 1.2 0.7 0.8 1.0 0.9 1.1 0.9 1.0<br />
1.7 1.3 1.1 1.0 1.4 1.6 1.9 1.8 1.3<br />
1.9 1.3 1.0 0.8 1.6 1.3 1.8 2.4 1.4<br />
2.0 1.4 1.1 1.1 1.8 1.5 2.4 2.7 1.6<br />
1.9 1.3 1.0 0.9 1.7 1.4 1.9 2.2 1.5<br />
2.0 1.5 1.1 1.2 1.8 1.7 1.8 2.1 1.6<br />
Data include high care residential, low care residential, EACH packages and CACPs.<br />
In March 2008, the Residential Classification Scale (RCS) was replaced by the Aged Care Funding<br />
Instrument (ACFI), but some residents remained under the RCS in June 2008. These calculations use<br />
both RCS and ACFI as they applied at June 2008. See Box 13.1 in the Aged care services chapter for<br />
more detail on these classifications.<br />
(c) Includes Multipurpose Services and National Aboriginal and Torres Strait Islander Flexible Aged Care<br />
Program places attributed as aged care recipients, in all years except 2007.<br />
(d) Population data for 2008 are calculated on a different basis to years prior to 2008. See table 13A.2 for<br />
notes and sources of population data.<br />
Source : DoHA (unpublished).<br />
REPORT ON<br />
GOVERNMENT<br />
SERVICES 2009<br />
AGED CARE<br />
SERVICES


