

Attachment tables only (PDF - 363 Kb)
Attachment tables only (PDF - 363 Kb)
Attachment tables only (PDF - 363 Kb)

Create successful ePaper yourself
Turn your PDF publications into a flip-book with our unique Google optimized e-Paper software.
Table 13A.9<br />
Table 13A.9<br />
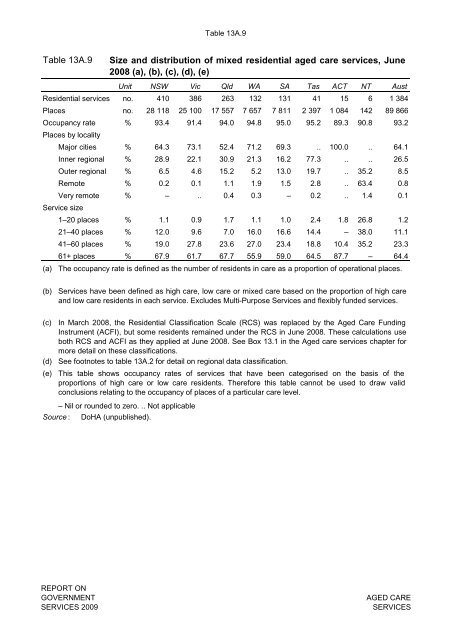
Size and distribution of mixed residential aged care services, June<br />
2008 (a), (b), (c), (d), (e)<br />
Unit NSW Vic Qld WA SA Tas ACT NT Aust<br />
Residential services no. 410 386 263 132 131 41 15 6 1 384<br />
Places no. 28 118 25 100 17 557 7 657 7 811 2 397 1 084 142 89 866<br />
Occupancy rate % 93.4 91.4 94.0 94.8 95.0 95.2 89.3 90.8 93.2<br />
Places by locality<br />
Major cities % 64.3 73.1 52.4 71.2 69.3 .. 100.0 .. 64.1<br />
Inner regional % 28.9 22.1 30.9 21.3 16.2 77.3 .. .. 26.5<br />
Outer regional % 6.5 4.6 15.2 5.2 13.0 19.7 .. 35.2 8.5<br />
Remote % 0.2 0.1 1.1 1.9 1.5 2.8 .. 63.4 0.8<br />
Very remote % – .. 0.4 0.3 – 0.2 .. 1.4 0.1<br />
Service size<br />
1–20 places % 1.1 0.9 1.7 1.1 1.0 2.4 1.8 26.8 1.2<br />
21–40 places % 12.0 9.6 7.0 16.0 16.6 14.4 – 38.0 11.1<br />
41–60 places % 19.0 27.8 23.6 27.0 23.4 18.8 10.4 35.2 23.3<br />
61+ places % 67.9 61.7 67.7 55.9 59.0 64.5 87.7 – 64.4<br />
(a) The occupancy rate is defined as the number of residents in care as a proportion of operational places.<br />
(b)<br />
Services have been defined as high care, low care or mixed care based on the proportion of high care<br />
and low care residents in each service. Excludes Multi-Purpose Services and flexibly funded services.<br />
(c)<br />
(d)<br />
(e)<br />
In March 2008, the Residential Classification Scale (RCS) was replaced by the Aged Care Funding<br />
Instrument (ACFI), but some residents remained under the RCS in June 2008. These calculations use<br />
both RCS and ACFI as they applied at June 2008. See Box 13.1 in the Aged care services chapter for<br />
more detail on these classifications.<br />
See footnotes to table 13A.2 for detail on regional data classification.<br />
Source :<br />
This table shows occupancy rates of services that have been categorised on the basis of the<br />
proportions of high care or low care residents. Therefore this table cannot be used to draw valid<br />
conclusions relating to the occupancy of places of a particular care level.<br />
– Nil or rounded to zero. .. Not applicable<br />
DoHA (unpublished).<br />
REPORT ON<br />
GOVERNMENT<br />
SERVICES 2009<br />
AGED CARE<br />
SERVICES


