

Attachment tables only (PDF - 363 Kb)
Attachment tables only (PDF - 363 Kb)
Attachment tables only (PDF - 363 Kb)

Create successful ePaper yourself
Turn your PDF publications into a flip-book with our unique Google optimized e-Paper software.
Table 13A.42<br />
Table 13A.42<br />
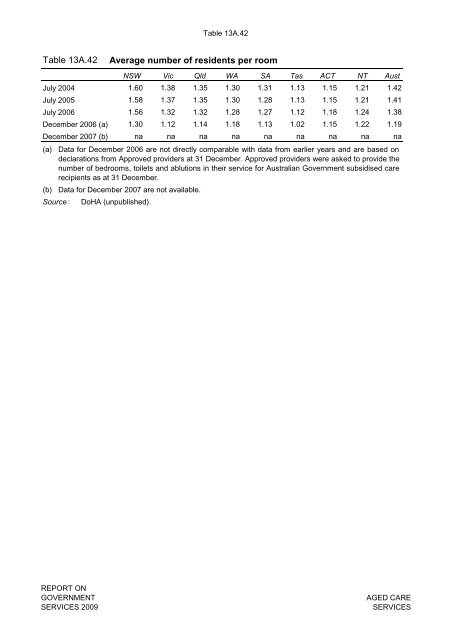
Average number of residents per room<br />
NSW Vic Qld WA SA Tas ACT NT Aust<br />
July 2004 1.60 1.38 1.35 1.30 1.31 1.13 1.15 1.21 1.42<br />
July 2005 1.58 1.37 1.35 1.30 1.28 1.13 1.15 1.21 1.41<br />
July 2006 1.56 1.32 1.32 1.28 1.27 1.12 1.18 1.24 1.38<br />
December 2006 (a) 1.30 1.12 1.14 1.18 1.13 1.02 1.15 1.22 1.19<br />
December 2007 (b) na na na na na na na na na<br />
(a) Data for December 2006 are not directly comparable with data from earlier years and are based on<br />
declarations from Approved providers at 31 December. Approved providers were asked to provide the<br />
number of bedrooms, toilets and ablutions in their service for Australian Government subsidised care<br />
recipients as at 31 December.<br />
(b) Data for December 2007 are not available.<br />
Source : DoHA (unpublished).<br />
REPORT ON<br />
GOVERNMENT<br />
SERVICES 2009<br />
AGED CARE<br />
SERVICES


