

Attachment tables only (PDF - 363 Kb)
Attachment tables only (PDF - 363 Kb)
Attachment tables only (PDF - 363 Kb)

Create successful ePaper yourself
Turn your PDF publications into a flip-book with our unique Google optimized e-Paper software.
Contents<br />
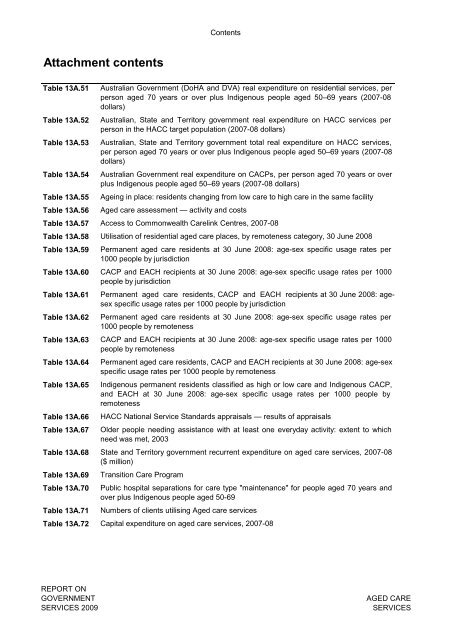
<strong>Attachment</strong> contents<br />
Table 13A.51 Australian Government (DoHA and DVA) real expenditure on residential services, per<br />
person aged 70 years or over plus Indigenous people aged 50–69 years (2007-08<br />
dollars)<br />
Table 13A.52 Australian, State and Territory government real expenditure on HACC services per<br />
person in the HACC target population (2007-08 dollars)<br />
Table 13A.53 Australian, State and Territory government total real expenditure on HACC services,<br />
per person aged 70 years or over plus Indigenous people aged 50–69 years (2007-08<br />
dollars)<br />
Table 13A.54 Australian Government real expenditure on CACPs, per person aged 70 years or over<br />
plus Indigenous people aged 50–69 years (2007-08 dollars)<br />
Table 13A.55 Ageing in place: residents changing from low care to high care in the same facility<br />
Table 13A.56 Aged care assessment — activity and costs<br />
Table 13A.57 Access to Commonwealth Carelink Centres, 2007-08<br />
Table 13A.58 Utilisation of residential aged care places, by remoteness category, 30 June 2008<br />
Table 13A.59 Permanent aged care residents at 30 June 2008: age-sex specific usage rates per<br />
1000 people by jurisdiction<br />
Table 13A.60 CACP and EACH recipients at 30 June 2008: age-sex specific usage rates per 1000<br />
people by jurisdiction<br />
Table 13A.61 Permanent aged care residents, CACP and EACH recipients at 30 June 2008: agesex<br />
specific usage rates per 1000 people by jurisdiction<br />
Table 13A.62 Permanent aged care residents at 30 June 2008: age-sex specific usage rates per<br />
1000 people by remoteness<br />
Table 13A.63 CACP and EACH recipients at 30 June 2008: age-sex specific usage rates per 1000<br />
people by remoteness<br />
Table 13A.64 Permanent aged care residents, CACP and EACH recipients at 30 June 2008: age-sex<br />
specific usage rates per 1000 people by remoteness<br />
Table 13A.65 Indigenous permanent residents classified as high or low care and Indigenous CACP,<br />
and EACH at 30 June 2008: age-sex specific usage rates per 1000 people by<br />
remoteness<br />
Table 13A.66 HACC National Service Standards appraisals — results of appraisals<br />
Table 13A.67 Older people needing assistance with at least one everyday activity: extent to which<br />
need was met, 2003<br />
Table 13A.68 State and Territory government recurrent expenditure on aged care services, 2007-08<br />
($ million)<br />
Table 13A.69 Transition Care Program<br />
Table 13A.70 Public hospital separations for care type "maintenance" for people aged 70 years and<br />
over plus Indigenous people aged 50-69<br />
Table 13A.71 Numbers of clients utilising Aged care services<br />
Table 13A.72 Capital expenditure on aged care services, 2007-08<br />
REPORT ON<br />
GOVERNMENT<br />
SERVICES 2009<br />
AGED CARE<br />
SERVICES


