

CHAPTER 13 Simple Linear Regression
CHAPTER 13 Simple Linear Regression
CHAPTER 13 Simple Linear Regression

You also want an ePaper? Increase the reach of your titles
YUMPU automatically turns print PDFs into web optimized ePapers that Google loves.
526 <strong>CHAPTER</strong> THIRTEEN <strong>Simple</strong> <strong>Linear</strong> <strong>Regression</strong><br />
The Coefficient of Determination<br />
By themselves, SSR, SSE, and SST provide little information. However, the ratio of the regression<br />
sum of squares (SSR) to the total sum of squares (SST ) measures the proportion of variation<br />
in Y that is explained by the independent variable X in the regression model. This ratio is<br />
called the coefficient of determination, r 2 , and is defined in Equation (<strong>13</strong>.9).<br />
COEFFICIENT OF DETERMINATION<br />
The coefficient of determination is equal to the regression sum of squares (that is,<br />
explained variation) divided by the total sum of squares (that is, total variation).<br />
r<br />
2 <strong>Regression</strong> sum of squares<br />
= =<br />
Total sum of squares<br />
SSR<br />
SST<br />
(<strong>13</strong>.9)<br />
The coefficient of determination measures the proportion of variation in Y that is explained<br />
by the independent variable X in the regression model. For the Sunflowers Apparel data, with<br />
SSR = 105.7476, SSE = 11.2067, and SST = 116.9543,<br />
r 2 105.<br />
7476<br />
= = 0.<br />
9042<br />
116.<br />
9543<br />
Therefore, 90.42% of the variation in annual sales is explained by the variability in the size of the<br />
store, as measured by the square footage. This large r 2 indicates a strong positive linear relationship<br />
between two variables because the use of a regression model has reduced the variability in<br />
predicting annual sales by 90.42%. Only 9.58% of the sample variability in annual sales is due to<br />
factors other than what is accounted for by the linear regression model that uses square footage.<br />
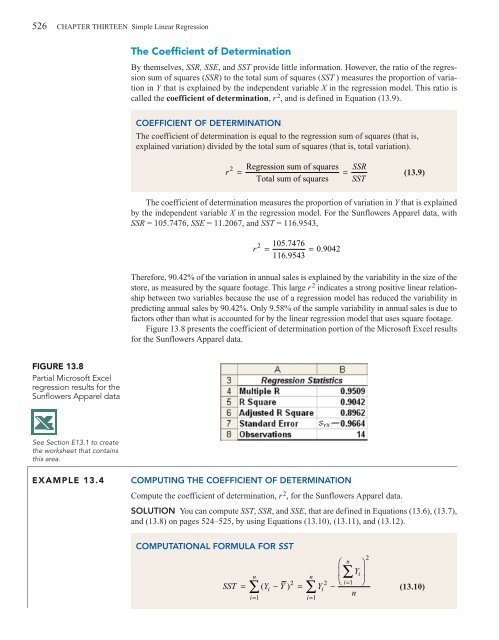
Figure <strong>13</strong>.8 presents the coefficient of determination portion of the Microsoft Excel results<br />
for the Sunflowers Apparel data.<br />
FIGURE <strong>13</strong>.8<br />
Partial Microsoft Excel<br />
regression results for the<br />
Sunflowers Apparel data<br />
S YX<br />
See Section E<strong>13</strong>.1 to create<br />
the worksheet that contains<br />
this area.<br />
EXAMPLE <strong>13</strong>.4<br />
COMPUTING THE COEFFICIENT OF DETERMINATION<br />
Compute the coefficient of determination, r 2 , for the Sunflowers Apparel data.<br />
SOLUTION You can compute SST, SSR, and SSE, that are defined in Equations (<strong>13</strong>.6), (<strong>13</strong>.7),<br />
and (<strong>13</strong>.8) on pages 524–525, by using Equations (<strong>13</strong>.10), (<strong>13</strong>.11), and (<strong>13</strong>.12).<br />
COMPUTATIONAL FORMULA FOR SST<br />
2<br />
⎛ n ⎞<br />
⎜ Y<br />
n<br />
n ∑ i⎟<br />
⎝ i=<br />
⎠<br />
SST = ∑ ( Yi<br />
− Y )2 = ∑Yi<br />
2 −<br />
1 n<br />
i=<br />
1<br />
i=<br />
1<br />
(<strong>13</strong>.10)


