CHAPTER 13 Simple Linear Regression
CHAPTER 13 Simple Linear Regression
CHAPTER 13 Simple Linear Regression
Create successful ePaper yourself
Turn your PDF publications into a flip-book with our unique Google optimized e-Paper software.
546 <strong>CHAPTER</strong> THIRTEEN <strong>Simple</strong> <strong>Linear</strong> <strong>Regression</strong><br />
a. Compute and interpret the coefficient of correlation, r.<br />
b. At the 0.05 level of significance, is there a significant<br />
linear relationship between the mileage as calculated by<br />
owners and by current government standards?<br />
<strong>13</strong>.53 College basketball is big business, with coaches’<br />
salaries, revenues, and expenses in millions of dollars. The<br />
data in the file colleges-basketball.xls represent the coaches’<br />
salaries and revenues for college basketball at selected<br />
schools in a recent year (extracted from R. Adams, “Pay for<br />
Playoffs,” The Wall Street Journal, March 11–12, 2006, pp.<br />
P1, P8).<br />
a. Compute and interpret the coefficient of correlation, r.<br />
b. At the 0.05 level of significance, is there a significant<br />
linear relationship between a coach’s salary and<br />
revenue?<br />
<strong>13</strong>.54 College football players trying out for the NFL are<br />
given the Wonderlic standardized intelligence test. The data in<br />
the file wonderlic.xls represent the average Wonderlic scores of<br />
football players trying out for the NFL and the graduation<br />
rates for football players at selected schools (extracted from<br />
S. Walker, “The NFL’s Smartest Team,” The Wall Street<br />
Journal, September 30, 2005, pp. W1, W10).<br />
a. Compute and interpret the coefficient of correlation, r.<br />
b. At the 0.05 level of significance, is there a significant<br />
linear relationship between the average Wonderlic score<br />
of football players trying out for the NFL and the graduation<br />
rates for football players at selected schools?<br />
c. What conclusions can you reach about the relationship<br />
between the average Wonderlic score of football players<br />
trying out for the NFL and the graduation rates for football<br />
players at selected schools?<br />
<strong>13</strong>.8 ESTIMATION OF MEAN VALUES AND PREDICTION<br />
OF INDIVIDUAL VALUES<br />
This section presents methods of making inferences about the mean of Y and predicting individual<br />
values of Y.<br />
The Confidence Interval Estimate<br />
In Example <strong>13</strong>.2 on page 519, you used the prediction line to predict the value of Y for a given<br />
X. The mean annual sales for stores with 4,000 square feet was predicted to be 7.644 millions<br />
of dollars ($7,644,000). This estimate, however, is a point estimate of the population mean. In<br />
Chapter 8, you studied the concept of the confidence interval as an estimate of the population<br />
mean. In a similar fashion, Equation (<strong>13</strong>.20) defines the confidence interval estimate for the<br />
mean response for a given X.<br />
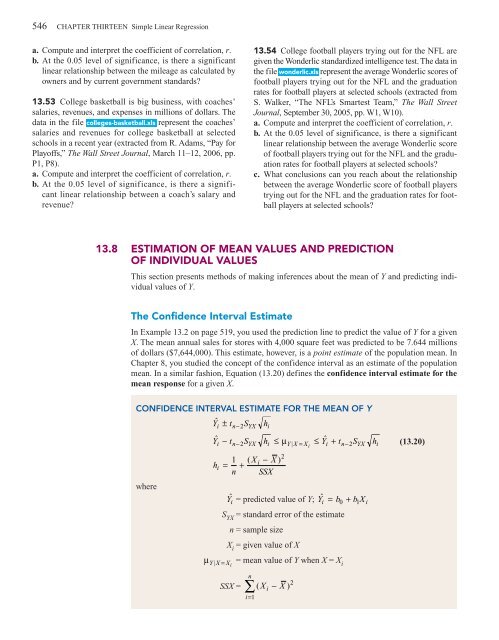
CONFIDENCE INTERVAL ESTIMATE FOR THE MEAN OF Y<br />
Yˆ<br />
i ± tn−2SYX hi<br />
Yˆ<br />
− t S h ≤ µ ≤ Yˆ<br />
+ t S h<br />
where<br />
h<br />
i n− 2 YX i Y | X = Xi<br />
i n−2<br />
YX i<br />
2<br />
i<br />
1 ( Xi<br />
− X)<br />
= +<br />
n SSX<br />
Yˆ<br />
i = predicted value of Y; Yˆ<br />
i = b0 + b1X<br />
S YX<br />
= standard error of the estimate<br />
n = sample size<br />
X i<br />
= given value of X<br />
i<br />
(<strong>13</strong>.20)<br />
µ YX | = Xi<br />
= mean value of Y when X = X i<br />
n<br />
∑<br />
SSX = ( X − X)<br />
i=<br />
1<br />
i<br />
2


