

CHAPTER 13 Simple Linear Regression
CHAPTER 13 Simple Linear Regression
CHAPTER 13 Simple Linear Regression

You also want an ePaper? Increase the reach of your titles
YUMPU automatically turns print PDFs into web optimized ePapers that Google loves.
516 <strong>CHAPTER</strong> THIRTEEN <strong>Simple</strong> <strong>Linear</strong> <strong>Regression</strong><br />
where<br />
Yˆ<br />
i = predicted value of Y for observation i<br />
X i<br />
= value of X for observation i<br />
b 0<br />
= sample Y intercept<br />
b 1<br />
= sample slope<br />
Equation (<strong>13</strong>.2) requires the determination of two regression coefficients—b 0<br />
(the sample<br />
Y intercept) and b 1<br />
(the sample slope). The most common approach to finding b 0<br />
and b 1<br />
is the<br />
method of least squares. This method minimizes the sum of the squared differences between<br />
the actual values (Y i<br />
) and the predicted values ( Yˆ i ) using the simple linear regression equation<br />
[that is, the prediction line; see Equation (<strong>13</strong>.2)]. This sum of squared differences is equal to<br />
n<br />
∑<br />
i=<br />
1<br />
( Y − Yˆ )<br />
i<br />
i<br />
2<br />
Because Yˆ<br />
= b + b X ,<br />
i<br />
0 1<br />
i<br />
n<br />
∑<br />
i=<br />
1<br />
n<br />
2<br />
i i ∑ i 0 1 i<br />
i=<br />
1<br />
( Y − Yˆ ) = [ Y − ( b + b X )]<br />
2<br />
Because this equation has two unknowns, b 0<br />
and b 1<br />
, the sum of squared differences depends on<br />
the sample Y intercept, b 0<br />
, and the sample slope, b 1<br />
. The least-squares method determines the<br />
values of b 0<br />
and b 1<br />
that minimize the sum of squared differences. Any values for b 0<br />
and b 1<br />
other than those determined by the least-squares method result in a greater sum of squared differences<br />
between the actual values (Y i<br />
) and the predicted values Yˆ<br />
i . In this book, Microsoft<br />
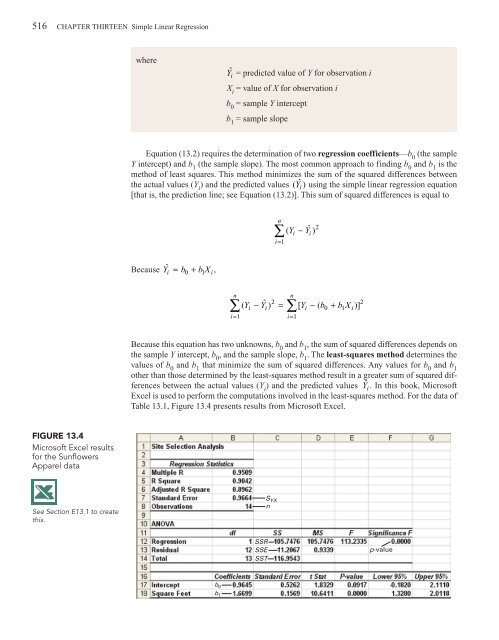
Excel is used to perform the computations involved in the least-squares method. For the data of<br />
Table <strong>13</strong>.1, Figure <strong>13</strong>.4 presents results from Microsoft Excel.<br />
FIGURE <strong>13</strong>.4<br />
Microsoft Excel results<br />
for the Sunflowers<br />
Apparel data<br />
See Section E<strong>13</strong>.1 to create<br />
this.<br />
S YX<br />
n<br />
SSR<br />
SSE<br />
SST<br />
p-value<br />
b 0<br />
b 1


