

CHAPTER 13 Simple Linear Regression
CHAPTER 13 Simple Linear Regression
CHAPTER 13 Simple Linear Regression

You also want an ePaper? Increase the reach of your titles
YUMPU automatically turns print PDFs into web optimized ePapers that Google loves.
542 <strong>CHAPTER</strong> THIRTEEN <strong>Simple</strong> <strong>Linear</strong> <strong>Regression</strong><br />
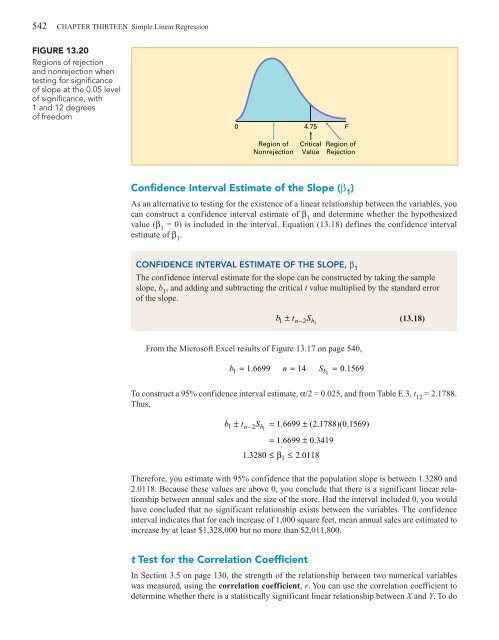
FIGURE <strong>13</strong>.20<br />
Regions of rejection<br />
and nonrejection when<br />
testing for significance<br />
of slope at the 0.05 level<br />
of significance, with<br />
1 and 12 degrees<br />
of freedom<br />
0 4.75 F<br />
Region of<br />
Nonrejection<br />
Critical<br />
Value<br />
Region of<br />
Rejection<br />
Confidence Interval Estimate of the Slope (β 1<br />
)<br />
As an alternative to testing for the existence of a linear relationship between the variables, you<br />
can construct a confidence interval estimate of β 1<br />
and determine whether the hypothesized<br />
value (β 1<br />
= 0) is included in the interval. Equation (<strong>13</strong>.18) defines the confidence interval<br />
estimate of β 1<br />
.<br />
CONFIDENCE INTERVAL ESTIMATE OF THE SLOPE, β 1<br />
The confidence interval estimate for the slope can be constructed by taking the sample<br />
slope, b 1<br />
, and adding and subtracting the critical t value multiplied by the standard error<br />
of the slope.<br />
b t S<br />
1 ± n − 2 b1<br />
(<strong>13</strong>.18)<br />
From the Microsoft Excel results of Figure <strong>13</strong>.17 on page 540,<br />
b 1 = 1. 6699 n = 14 S b = 0.<br />
1569<br />
To construct a 95% confidence interval estimate, α/2 = 0.025, and from Table E.3, t 12<br />
= 2.1788.<br />
Thus,<br />
b1 ± tn− 2Sb<br />
= 1. 6699 ± ( 2. 1788)( 0. 1569)<br />
1<br />
= 1. 6699 ± 0.<br />
3419<br />
1. 3280 ≤ β ≤ 2.<br />
0118<br />
1<br />
Therefore, you estimate with 95% confidence that the population slope is between 1.3280 and<br />
2.0118. Because these values are above 0, you conclude that there is a significant linear relationship<br />
between annual sales and the size of the store. Had the interval included 0, you would<br />
have concluded that no significant relationship exists between the variables. The confidence<br />
interval indicates that for each increase of 1,000 square feet, mean annual sales are estimated to<br />
increase by at least $1,328,000 but no more than $2,011,800.<br />
1<br />
t Test for the Correlation Coefficient<br />
In Section 3.5 on page <strong>13</strong>0, the strength of the relationship between two numerical variables<br />
was measured, using the correlation coefficient, r. You can use the correlation coefficient to<br />
determine whether there is a statistically significant linear relationship between X and Y. To do


