CHAPTER 13 Simple Linear Regression
CHAPTER 13 Simple Linear Regression
CHAPTER 13 Simple Linear Regression
You also want an ePaper? Increase the reach of your titles
YUMPU automatically turns print PDFs into web optimized ePapers that Google loves.
556 <strong>CHAPTER</strong> THIRTEEN <strong>Simple</strong> <strong>Linear</strong> <strong>Regression</strong><br />
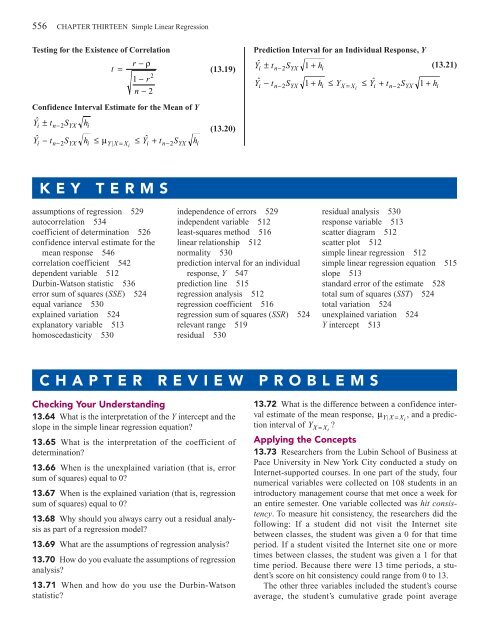
Testing for the Existence of Correlation<br />
Confidence Interval Estimate for the Mean of Y<br />
Yˆ<br />
± t S h<br />
i n−2<br />
YX i<br />
t =<br />
r − ρ<br />
1 − r<br />
n − 2<br />
Yˆ<br />
− t S h ≤ µ ≤ Yˆ<br />
+ t S h<br />
i n− 2 YX i Y | X = Xi<br />
i n−2<br />
YX i<br />
2<br />
(<strong>13</strong>.19)<br />
(<strong>13</strong>.20)<br />
Prediction Interval for an Individual Response, Y<br />
Yˆ<br />
± t S 1 + h<br />
i n−2<br />
YX i<br />
Yˆ<br />
− t S 1+ h ≤ Y ≤ Yˆ<br />
+ t S 1+<br />
h<br />
i n− 2 YX i X= Xi<br />
i n−2<br />
YX i<br />
(<strong>13</strong>.21)<br />
KEY TERMS<br />
assumptions of regression 529<br />
autocorrelation 534<br />
coefficient of determination 526<br />
confidence interval estimate for the<br />
mean response 546<br />
correlation coefficient 542<br />
dependent variable 512<br />
Durbin-Watson statistic 536<br />
error sum of squares (SSE) 524<br />
equal variance 530<br />
explained variation 524<br />
explanatory variable 5<strong>13</strong><br />
homoscedasticity 530<br />
independence of errors 529<br />
independent variable 512<br />
least-squares method 516<br />
linear relationship 512<br />
normality 530<br />
prediction interval for an individual<br />
response, Y 547<br />
prediction line 515<br />
regression analysis 512<br />
regression coefficient 516<br />
regression sum of squares (SSR) 524<br />
relevant range 519<br />
residual 530<br />
residual analysis 530<br />
response variable 5<strong>13</strong><br />
scatter diagram 512<br />
scatter plot 512<br />
simple linear regression 512<br />
simple linear regression equation 515<br />
slope 5<strong>13</strong><br />
standard error of the estimate 528<br />
total sum of squares (SST) 524<br />
total variation 524<br />
unexplained variation 524<br />
Y intercept 5<strong>13</strong><br />
<strong>CHAPTER</strong> REVIEW PROBLEMS<br />
Checking Your Understanding<br />
<strong>13</strong>.64 What is the interpretation of the Y intercept and the<br />
slope in the simple linear regression equation?<br />
<strong>13</strong>.65 What is the interpretation of the coefficient of<br />
determination?<br />
<strong>13</strong>.66 When is the unexplained variation (that is, error<br />
sum of squares) equal to 0?<br />
<strong>13</strong>.67 When is the explained variation (that is, regression<br />
sum of squares) equal to 0?<br />
<strong>13</strong>.68 Why should you always carry out a residual analysis<br />
as part of a regression model?<br />
<strong>13</strong>.69 What are the assumptions of regression analysis?<br />
<strong>13</strong>.70 How do you evaluate the assumptions of regression<br />
analysis?<br />
<strong>13</strong>.71 When and how do you use the Durbin-Watson<br />
statistic?<br />
<strong>13</strong>.72 What is the difference between a confidence interval<br />
estimate of the mean response, µ YX | = Xi<br />
, and a prediction<br />
interval of Y X = Xi<br />
?<br />
Applying the Concepts<br />
<strong>13</strong>.73 Researchers from the Lubin School of Business at<br />
Pace University in New York City conducted a study on<br />
Internet-supported courses. In one part of the study, four<br />
numerical variables were collected on 108 students in an<br />
introductory management course that met once a week for<br />
an entire semester. One variable collected was hit consistency.<br />
To measure hit consistency, the researchers did the<br />
following: If a student did not visit the Internet site<br />
between classes, the student was given a 0 for that time<br />
period. If a student visited the Internet site one or more<br />
times between classes, the student was given a 1 for that<br />
time period. Because there were <strong>13</strong> time periods, a student’s<br />
score on hit consistency could range from 0 to <strong>13</strong>.<br />
The other three variables included the student’s course<br />
average, the student’s cumulative grade point average


