

CHAPTER 13 Simple Linear Regression
CHAPTER 13 Simple Linear Regression
CHAPTER 13 Simple Linear Regression

You also want an ePaper? Increase the reach of your titles
YUMPU automatically turns print PDFs into web optimized ePapers that Google loves.
514 <strong>CHAPTER</strong> THIRTEEN <strong>Simple</strong> <strong>Linear</strong> <strong>Regression</strong><br />
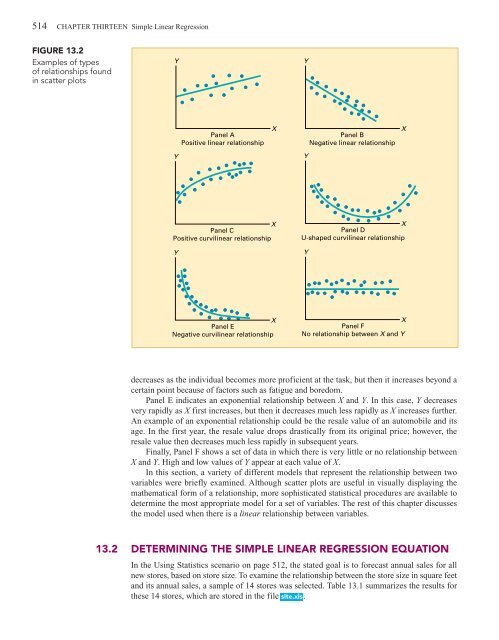
FIGURE <strong>13</strong>.2<br />
Examples of types<br />
of relationships found<br />
in scatter plots<br />
Y<br />
Y<br />
Panel A<br />
Positive linear relationship<br />
X<br />
Panel B<br />
Negative linear relationship<br />
X<br />
Y<br />
Y<br />
X<br />
Panel C<br />
Positive curvilinear relationship<br />
Y<br />
X<br />
Panel D<br />
U-shaped curvilinear relationship<br />
Y<br />
X<br />
Panel E<br />
Negative curvilinear relationship<br />
X<br />
Panel F<br />
No relationship between X and Y<br />
decreases as the individual becomes more proficient at the task, but then it increases beyond a<br />
certain point because of factors such as fatigue and boredom.<br />
Panel E indicates an exponential relationship between X and Y. In this case, Y decreases<br />
very rapidly as X first increases, but then it decreases much less rapidly as X increases further.<br />
An example of an exponential relationship could be the resale value of an automobile and its<br />
age. In the first year, the resale value drops drastically from its original price; however, the<br />
resale value then decreases much less rapidly in subsequent years.<br />
Finally, Panel F shows a set of data in which there is very little or no relationship between<br />
X and Y. High and low values of Y appear at each value of X.<br />
In this section, a variety of different models that represent the relationship between two<br />
variables were briefly examined. Although scatter plots are useful in visually displaying the<br />
mathematical form of a relationship, more sophisticated statistical procedures are available to<br />
determine the most appropriate model for a set of variables. The rest of this chapter discusses<br />
the model used when there is a linear relationship between variables.<br />
<strong>13</strong>.2 DETERMINING THE SIMPLE LINEAR REGRESSION EQUATION<br />
In the Using Statistics scenario on page 512, the stated goal is to forecast annual sales for all<br />
new stores, based on store size. To examine the relationship between the store size in square feet<br />
and its annual sales, a sample of 14 stores was selected. Table <strong>13</strong>.1 summarizes the results for<br />
these 14 stores, which are stored in the file site.xls.


