

CHAPTER 13 Simple Linear Regression
CHAPTER 13 Simple Linear Regression
CHAPTER 13 Simple Linear Regression

Create successful ePaper yourself
Turn your PDF publications into a flip-book with our unique Google optimized e-Paper software.
540 <strong>CHAPTER</strong> THIRTEEN <strong>Simple</strong> <strong>Linear</strong> <strong>Regression</strong><br />
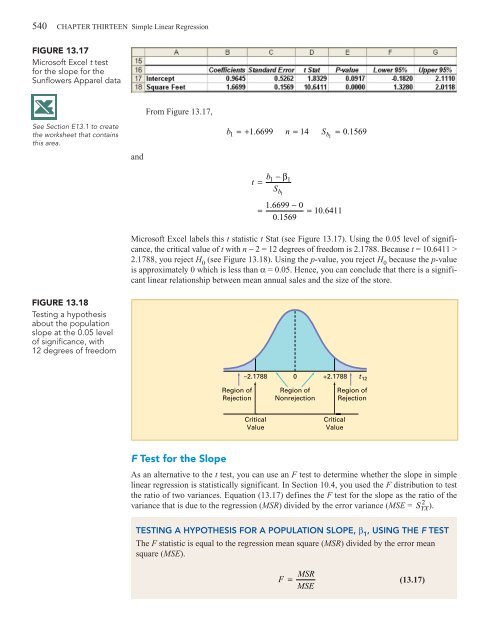
FIGURE <strong>13</strong>.17<br />
Microsoft Excel t test<br />
for the slope for the<br />
Sunflowers Apparel data<br />
From Figure <strong>13</strong>.17,<br />
See Section E<strong>13</strong>.1 to create<br />
the worksheet that contains<br />
this area.<br />
and<br />
b 1 =+ 1. 6699 n = 14 S b = 0.<br />
1569<br />
1<br />
t<br />
b1 − β1<br />
=<br />
S b 1<br />
1.<br />
6699 − 0<br />
=<br />
0.<br />
1569<br />
= 10.<br />
6411<br />
Microsoft Excel labels this t statistic t Stat (see Figure <strong>13</strong>.17). Using the 0.05 level of significance,<br />
the critical value of t with n − 2 = 12 degrees of freedom is 2.1788. Because t = 10.6411 ><br />
2.1788, you reject H 0<br />
(see Figure <strong>13</strong>.18). Using the p-value, you reject H 0<br />
because the p-value<br />
is approximately 0 which is less than α = 0.05. Hence, you can conclude that there is a significant<br />
linear relationship between mean annual sales and the size of the store.<br />
FIGURE <strong>13</strong>.18<br />
Testing a hypothesis<br />
about the population<br />
slope at the 0.05 level<br />
of significance, with<br />
12 degrees of freedom<br />
–2.1788 0 +2.1788 t 12<br />
Region of<br />
Rejection<br />
Region of<br />
Nonrejection<br />
Region of<br />
Rejection<br />
Critical<br />
Value<br />
Critical<br />
Value<br />
F Test for the Slope<br />
As an alternative to the t test, you can use an F test to determine whether the slope in simple<br />
linear regression is statistically significant. In Section 10.4, you used the F distribution to test<br />
the ratio of two variances. Equation (<strong>13</strong>.17) defines the F test for the slope as the ratio of the<br />
2<br />
variance that is due to the regression (MSR) divided by the error variance (MSE = ).<br />
S YX<br />
TESTING A HYPOTHESIS FOR A POPULATION SLOPE, β 1<br />
, USING THE F TEST<br />
The F statistic is equal to the regression mean square (MSR) divided by the error mean<br />
square (MSE).<br />
F<br />
=<br />
MSR<br />
MSE<br />
(<strong>13</strong>.17)


