

CHAPTER 13 Simple Linear Regression
CHAPTER 13 Simple Linear Regression
CHAPTER 13 Simple Linear Regression

You also want an ePaper? Increase the reach of your titles
YUMPU automatically turns print PDFs into web optimized ePapers that Google loves.
512 <strong>CHAPTER</strong> THIRTEEN <strong>Simple</strong> <strong>Linear</strong> <strong>Regression</strong><br />
Using Statistics @ Sunflowers Apparel<br />
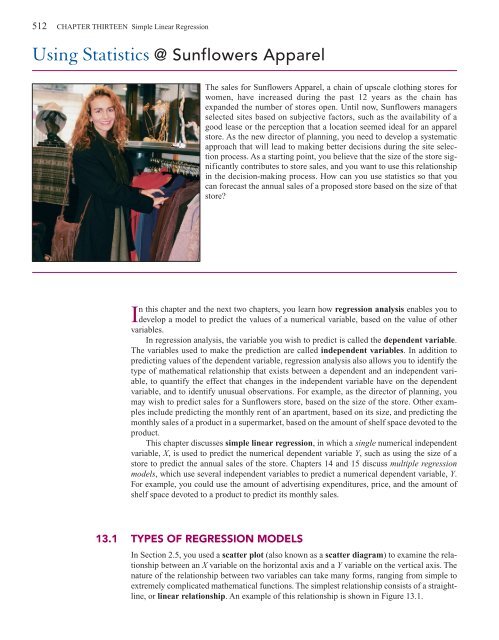
The sales for Sunflowers Apparel, a chain of upscale clothing stores for<br />
women, have increased during the past 12 years as the chain has<br />
expanded the number of stores open. Until now, Sunflowers managers<br />
selected sites based on subjective factors, such as the availability of a<br />
good lease or the perception that a location seemed ideal for an apparel<br />
store. As the new director of planning, you need to develop a systematic<br />
approach that will lead to making better decisions during the site selection<br />
process. As a starting point, you believe that the size of the store significantly<br />
contributes to store sales, and you want to use this relationship<br />
in the decision-making process. How can you use statistics so that you<br />
can forecast the annual sales of a proposed store based on the size of that<br />
store?<br />
In this chapter and the next two chapters, you learn how regression analysis enables you to<br />
develop a model to predict the values of a numerical variable, based on the value of other<br />
variables.<br />
In regression analysis, the variable you wish to predict is called the dependent variable.<br />
The variables used to make the prediction are called independent variables. In addition to<br />
predicting values of the dependent variable, regression analysis also allows you to identify the<br />
type of mathematical relationship that exists between a dependent and an independent variable,<br />
to quantify the effect that changes in the independent variable have on the dependent<br />
variable, and to identify unusual observations. For example, as the director of planning, you<br />
may wish to predict sales for a Sunflowers store, based on the size of the store. Other examples<br />
include predicting the monthly rent of an apartment, based on its size, and predicting the<br />
monthly sales of a product in a supermarket, based on the amount of shelf space devoted to the<br />
product.<br />
This chapter discusses simple linear regression, in which a single numerical independent<br />
variable, X, is used to predict the numerical dependent variable Y, such as using the size of a<br />
store to predict the annual sales of the store. Chapters 14 and 15 discuss multiple regression<br />
models, which use several independent variables to predict a numerical dependent variable, Y.<br />
For example, you could use the amount of advertising expenditures, price, and the amount of<br />
shelf space devoted to a product to predict its monthly sales.<br />
<strong>13</strong>.1 TYPES OF REGRESSION MODELS<br />
In Section 2.5, you used a scatter plot (also known as a scatter diagram) to examine the relationship<br />
between an X variable on the horizontal axis and a Y variable on the vertical axis. The<br />
nature of the relationship between two variables can take many forms, ranging from simple to<br />
extremely complicated mathematical functions. The simplest relationship consists of a straightline,<br />
or linear relationship. An example of this relationship is shown in Figure <strong>13</strong>.1.


