- Page 1 and 2:
Volume I THE 19 TH ANNUAL CLEMENT S
- Page 3 and 4:
19 th Annual Clement S. Stacy Under
- Page 5 and 6:
19 th Annual Clement S. Stacy Under
- Page 7 and 8:
which focus on the taglines and nar
- Page 9 and 10:
Table 1 - Comparison of Word Choice
- Page 11 and 12:
Crassus. Just from this, one can se
- Page 13 and 14:
Carman Anderson Carthage College Ac
- Page 15 and 16:
Once Achilleus does in fact kill He
- Page 17 and 18:
Once he tired of the slaughter, he
- Page 19 and 20:
linds both men, they both fight the
- Page 21 and 22:
MATERIALS Advertisement fo
- Page 23 and 24:
number of different sentences parti
- Page 25 and 26:
The second experiment of the curren
- Page 27 and 28:
experiment had the same results as
- Page 29 and 30:
Creating animated pictures is much
- Page 31 and 32:
to rate how well the sentence descr
- Page 33 and 34:
Megan Arkenberg Carroll University
- Page 35 and 36:
Unsurprisingly for a woman who func
- Page 37 and 38:
his reader of Circes in the final l
- Page 39 and 40:
Ralegh, Walter. "Farewell, False Lo
- Page 41 and 42:
when she said this, but her union e
- Page 43 and 44:
20 years after the Glass Ceiling Co
- Page 45 and 46:
Regina Betz Georgian Court Universi
- Page 47 and 48:
The narrator suggests that he seems
- Page 49 and 50:
“occupation for a long time was t
- Page 51 and 52:
loved by someone because her family
- Page 53 and 54:
Works Cited Brennan, Joseph X. “I
- Page 55 and 56:
naivety is seen when she believes h
- Page 57 and 58:
In Iranian culture, the Shahnameh e
- Page 59 and 60:
check herself for indecencies. Marj
- Page 61 and 62:
Works Cited Chute, Hillary. “The
- Page 63 and 64:
order for such a champion to emerge
- Page 65 and 66:
the room to find his mother sitting
- Page 67 and 68:
Works Cited McMichael, George. Anth
- Page 69 and 70:
father and speaks out in public and
- Page 71 and 72:
not know why she is suddenly able t
- Page 73 and 74:
ebelling, but then fixes the rebell
- Page 75 and 76:
attracted to each other, Hippolyta
- Page 77 and 78:
heated, and for good reason. In add
- Page 79 and 80:
Deidre Bridges Bethel College Analy
- Page 81 and 82:
the dismal conditions of his prison
- Page 83 and 84:
spirit, but Dr. Manette does not an
- Page 85 and 86:
interactions, especially Charles Da
- Page 87 and 88:
Stephanie Brownell Carroll Universi
- Page 89 and 90:
complementarity” (Corbett 846). M
- Page 91 and 92:
hunts,” such as the post-World Wa
- Page 93 and 94: heterosexism, a word that would tak
- Page 95 and 96: iologically predetermined, then sur
- Page 97 and 98: The Human Rights Campaign. “The U
- Page 99 and 100: Schematic and Bizarreness Effects i
- Page 101 and 102: take place before recruiting subjec
- Page 103 and 104: not fade from our minds. After retr
- Page 105 and 106: Agents are the subjects of the scen
- Page 107 and 108: for recall either, likely due to th
- Page 109 and 110: detached from it. When the main cha
- Page 111 and 112: she instead thanks him for saving h
- Page 113 and 114: Josh Connelly University of Michiga
- Page 115 and 116: In the end Charlie Wade’s death u
- Page 117 and 118: Works Cited Anzaldua, Gloria. “Ho
- Page 119 and 120: time period were allowed to have (T
- Page 121 and 122: (2.4.94). Since Rosalind’s father
- Page 123 and 124: Caitlin E. Cushing Purdue Universit
- Page 125 and 126: culture. They are two-dimensional i
- Page 127 and 128: during Lent. However, at the heart
- Page 129 and 130: theological practices of the Norman
- Page 131 and 132: Work Cited Chadwick, Henry. East an
- Page 133 and 134: through many states in the vicinity
- Page 135 and 136: dollars in one year. Thus when the
- Page 137 and 138: Works Cited Brinkle, Douglas, The U
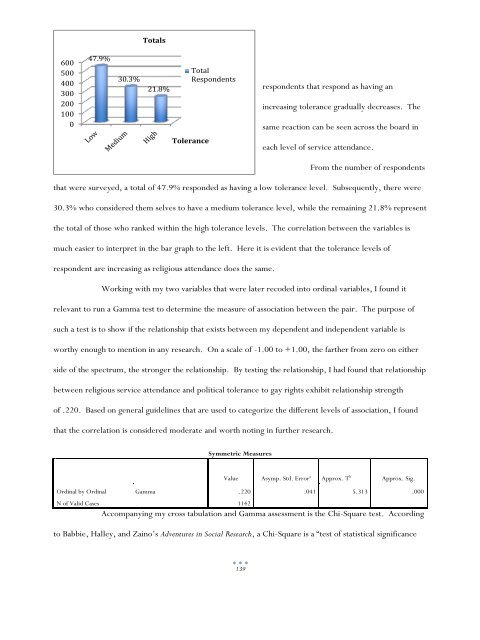
- Page 139 and 140: The following research will proceed
- Page 141 and 142: and denouncing the issue (Herek 42)
- Page 143: Running frequencies on each variabl
- Page 147 and 148: each religion has different toleran
- Page 149 and 150: ectol recoded version of pol tolera
- Page 151 and 152: attend HOW OFTEN R ATTENDS RELIGIOU
- Page 153 and 154: ANOVA b Model Sum of Squares df Mea
- Page 155 and 156: tolord Recode into ordinal Toleranc
- Page 157 and 158: Julie Didonna Purdue University Cal
- Page 159 and 160: Believe in all the books. 4) Belief
- Page 161 and 162: effect”, after the bombings took
- Page 163 and 164: Islamic Center in combination with
- Page 165 and 166: Felicia Dieguez Purdue University C
- Page 167 and 168: Synthesis of the Holy and the Secul
- Page 169 and 170: sin. A large part of her faith was
- Page 171 and 172: Personification In addition to thei
- Page 173 and 174: In Sermon 4 on the Song of Songs, B
- Page 175 and 176: Eric RM Doornbos Calvin College A R
- Page 177 and 178: motion World War I. The second seri
- Page 179 and 180: Bosnia will be the key test of Amer
- Page 181 and 182: efforts at integration are ongoing
- Page 183 and 184: Fact Book). Bosnia's GDP reached an
- Page 185 and 186: it became apparent that there was n
- Page 187 and 188: present. One area in which Bosnian
- Page 189 and 190: Most Opdna - a typical Bosniak stro
- Page 191 and 192: own right, ready to pursue its own
- Page 193 and 194: In light of this question, the Unit
- Page 195 and 196:
esources, and financial support tha
- Page 197 and 198:
Tyler J. Doyon University of Michig
- Page 199 and 200:
not only insult the men; it also gi
- Page 201 and 202:
the one found in Magritte’s paint
- Page 203 and 204:
masterpiece. First, though, it is e
- Page 205 and 206:
“sometimes hug, and sometimes tea
- Page 207 and 208:
One overwhelmingly popular conclusi
- Page 209 and 210:
Works Cited Brown, Norman O. “The
- Page 211 and 212:
hint of red at his lapels. Two of h
- Page 213 and 214:
stems solely from the threat of wha
- Page 215 and 216:
Jessica Gallinatti Purdue Universit
- Page 217 and 218:
e a baby could instigate her dream
- Page 219 and 220:
male genitals but in female ovaries
- Page 221 and 222:
In conclusion, the book and film ar
- Page 223 and 224:
Benchmarking Before starting our co
- Page 225 and 226:
evealed that in order to get the co
- Page 227 and 228:
etc. It would also be important to
- Page 229 and 230:
to predict the overall characterist
- Page 231 and 232:
“16 and Pregnant a show that beca
- Page 233 and 234:
dads leaving, and the dads should p
- Page 235 and 236:
symbol system. Some means of cathar
- Page 237 and 238:
Basically, in mortification the gui
- Page 239 and 240:
attempting to still have a social l
- Page 241 and 242:
wouldn’t want her here with you
- Page 243 and 244:
and „The City‟ and „The Real
- Page 245 and 246:
“Looking for Love”. MTV. Execut
- Page 247 and 248:
Mark Hemmert Central Michigan Unive
- Page 249 and 250:
A major problem central to the argu
- Page 251 and 252:
Phelps, the leader of the organizat
- Page 253 and 254:
Works Cited Charles Kimball, When R
- Page 255 and 256:
problems started in the Soviet Unio
- Page 257 and 258:
VI. Now that we can see the entiret
- Page 259 and 260:
The extent of the problem is widesp
- Page 261 and 262:
emission levels until around 2020,
- Page 263 and 264:
The bottom line of this is that oth
- Page 265 and 266:
Lungescu, Oana. “EU Tackles Russi
- Page 267 and 268:
guilelessness, etc.], but it is nec
- Page 269 and 270:
him, which are certainly not the ac
- Page 271 and 272:
However, by itself, Richard the Thi
- Page 273 and 274:
Hamlet’s unwillingness to take ac
- Page 275 and 276:
Montoya. In doing so Sam starts to
- Page 277 and 278:
and fair man, despite his faults. I
- Page 279 and 280:
Kendall Hylton Purdue University Ca
- Page 281 and 282:
people who differ from one’s own
- Page 283 and 284:
agerec1 1.00 18-29 2.00 30-49 3.00
- Page 285 and 286:
Ordinal by Gamma -.118 .040 -2.949
- Page 287 and 288:
The research that I did showed that
- Page 289 and 290:
marriage between a man and a woman
- Page 291 and 292:
they were more likely to favor gay
- Page 293 and 294:
as straight. The Lewis article also
- Page 295 and 296:
interviews would take a take a tota
- Page 297 and 298:
variable value we are interested in
- Page 299 and 300:
The multiple regression analysis as
- Page 301 and 302:
the other predictors, a negative sl
- Page 303 and 304:
predictor than both race and gender
- Page 305 and 306:
Works Cited Allison, P. D. (1999).
- Page 307 and 308:
TABLE B- RECHOMIND FREQUENCY Homose
- Page 309 and 310:
N of Valid Cases 1336 a. 2 cells (1
- Page 311 and 312:
econsideration in which intertextua
- Page 313 and 314:
manic in his emotions, and this man
- Page 315 and 316:
papers for September-October 1952 a
- Page 317 and 318:
(272). Ironically, Quilty proves mo
- Page 319 and 320:
memoir: “Lolita, light of my life
- Page 321 and 322:
did not compose”—yet Quilty man
- Page 323 and 324:
them as “men of power.” Dr. Zem
- Page 325 and 326:
Adrian Lyne’s Lolita As the third
- Page 327 and 328:
Schiff originates Humbert as tormen
- Page 329 and 330:
Humbert and Lolita and the gradual
- Page 331 and 332:
ather, the enterprise exists based
- Page 333 and 334:
Kevin Johnston University of Michig
- Page 335 and 336:
commenting/Upon the sobbing deer”
- Page 337 and 338:
Through the use of surrealism, McAn
- Page 339 and 340:
Marshall handed down his opinion in
- Page 341 and 342:
(Gibbons v Ogden). So if Congress w
- Page 343 and 344:
These acts undoubtedly exceed both
- Page 345 and 346:
In Ex Parte Quirin the question bro
- Page 347 and 348:
The Civil Rights Era During the Civ
- Page 349 and 350:
declared judicial supremacy. “…
- Page 351 and 352:
“This right of privacy, whether f
- Page 353 and 354:
Commerce Clause to a general police
- Page 355 and 356:
It is also trying to redefine Const
- Page 357:
Hamdan v Rumsfeld. No. 548 U.S. 547