Chitosan Loaded Mucoadhesive Microspheres of Gliclazide - Journal
Chitosan Loaded Mucoadhesive Microspheres of Gliclazide - Journal
Chitosan Loaded Mucoadhesive Microspheres of Gliclazide - Journal

Create successful ePaper yourself
Turn your PDF publications into a flip-book with our unique Google optimized e-Paper software.
again weighed and recorded. Followed by 2 trials were done.<br />
Then the average <strong>of</strong> initial weights and final weights were<br />
recorded.<br />
initial weight - Final weight<br />
% Friability = ---------------------------------------- * 100<br />
Initial weight<br />
In-vitro <strong>Mucoadhesive</strong> Strength Measurement<br />
Porcine buccal mucosa was obtained from local slaughter<br />
house and stored in Kreb's buffer solution. The experiment<br />
was performed within the 3 hours <strong>of</strong> procurement <strong>of</strong> mucosa.<br />
The porcine mucosa was washed with the distilled water and<br />
carefully tied to the glass slide with the help <strong>of</strong> cyanoacrylate<br />
adhesive and placed in petridish. Kreb's solution was added<br />
into the petridish up to the upper surface <strong>of</strong> the buccal mucosa<br />
to maintain buccal mucosal viability during the experiment.<br />
During the experiment the solution was maintained at 37°C.<br />
The tablet was stuck on to the glass stopper by using<br />
cyanoacrylate adhesive. The preload <strong>of</strong> 20 gm was placed on<br />
the glass stopper for 7 minutes to establish the adhesion<br />
bonding between tablet and porcine buccal mucosa. The<br />
preload and preload time were kept constant for all<br />
formulations. The preload was removed from stopper and<br />
water was added in to beaker from separating funnel at a<br />
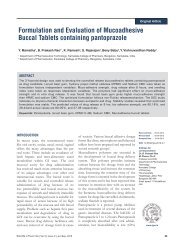
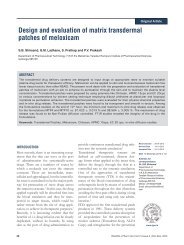
constant rate <strong>of</strong> 100 drops per minute (Fig 1). The addition <strong>of</strong><br />
the water was stopped when the tablet was removed from<br />
porcine buccal mucosa. The weight <strong>of</strong> water collected in<br />
5<br />
beaker was weighed which is taken as mucoadhesive strength .<br />
In-vitro Dissolution Studies<br />
The dissolution studies <strong>of</strong> the buccoadhesive tablet was<br />
performed in 900 ml <strong>of</strong> phosphate buffer (pH=6.8) using the<br />
USP type II dissolution apparatus under sink condition at 37<br />
0<br />
± 0.2 C and 50 rpm. At the appropriate time interval, the<br />
sample was withdrawn and volume made up with distilled<br />
water. The samples were filtered through a 0.45 µm Millipore<br />
filter and amount <strong>of</strong> MT which was released determined<br />
spectrophotometrically at 274 nm and the release data were<br />
17<br />
evaluated kinetically .<br />
Glass Stopper<br />
Buccal Tablet<br />
Buccal mucosa<br />
Prakash Rao B et al./ Formulation and Evaluation <strong>of</strong> <strong>Mucoadhesive</strong> Buccal Drug Delivery System <strong>of</strong> Metoprolol Tartrate by Using Central Composite Design<br />
Fig. 1: Schematic diagram <strong>of</strong> in-vitro bioadhesive<br />
strength measurement device<br />
Separating Funnel<br />
148<br />
Analytical Method<br />
Accurate weight <strong>of</strong> powder equivalent to 50 mg metoprolol<br />
tartrate was taken and transferred in to 100 ml volumetric<br />
flask and volume was made up with distilled water. The<br />
powder solution was transferred in 250 ml <strong>of</strong> beaker and<br />
heated for 30 minutes for the extraction <strong>of</strong> the drug. Then, the<br />
solution was cooled and filtered. The samples were diluted<br />
appropriately and the absorbance was measured at 274 nm<br />
using the Shimadzu (model 1601) UV- visible<br />
16<br />
spectrophotometer.<br />
Regression Analysis<br />
The response parameters were statistically analyzed by<br />
applying one way ANOVA at 0.05 levels using commercially<br />
available s<strong>of</strong>tware Design-Expert s<strong>of</strong>tware (Stat-Ease Inc,<br />
Minneapolis, USA). The individual parameters were<br />
evaluated using the F test and Linear, 2FI, Quadratic models<br />
were generated for each response parameter using the<br />
multiple linear regression analysis (MLRA) equation:<br />
2 2 2 2<br />
R = b 0 + b 1 A+ b2B + b3AB + b4A + b5B + b6AB + b7A B (1)<br />
Where, R is the level <strong>of</strong> measured response, b 0 is the intercept<br />
<strong>of</strong> the arithmetic mean response <strong>of</strong> the 13 runs, A and B are<br />
the coded level <strong>of</strong> the independent variables. The AB is the<br />
interaction term, show how response changes when two<br />
2 2<br />
factors are simultaneously used. A , B are quadratic terms <strong>of</strong><br />
the independent variables to evaluate the nonlinearity.<br />
Kinetic release Studies<br />
For the determination <strong>of</strong> the drug release kinetics from the<br />
buccal tablet, the in vitro release data were analyzed by zero<br />
order, first order, Higuchi and Korsmeyer and Peppas<br />
17<br />
equations .<br />
Zero order release Kinetic<br />
To study the zero order release kinetics the release data was<br />
fitted into the Following equation:<br />
dQ/dt = K (2)<br />
0<br />
Where, 'Q' is the amount <strong>of</strong> drug release, 'K ' is the zero order<br />
0<br />
release rate constant and 't' is the release time. The graph is<br />
plotted percentage cumulative drug release (%CDR) verses<br />
time.<br />
First Order Release Kinetic<br />
To study the first order release kinetics the release rate data are<br />
fitted into the following equation:<br />
dQ/dt = K Q (3)<br />
1<br />
Where, 'Q' is the fraction <strong>of</strong> drug release, 'K ' is the first order<br />
1<br />
release rate constant and't' is the release time. The graph is<br />
plotted log %CDR remaining verse time.<br />
RJPS, Jul - Sep, 2011/ Vol 1/ Issue 2