Children in Out-of-Home Placement Children and Youth in Out-of-Home Placement, by Type of Setting and Age, <strong>Rhode</strong> <strong>Island</strong>, January 5, <strong>2010</strong> In Foster Care Homes 9% (112) Under Age 1 33% (397) Ages 1 to 5 33% (394) Ages 6 to 13 22% (269) Ages 14 to 17 3% (33) Ages 18 and Older In Group Homes and Residential Facilities* 1% (5) Under Age 1
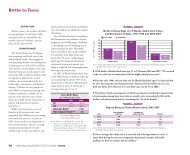
Permanency for Children in DCYF Care DEFINITION Permanency for children in DCYF Care is the percentage of children in out-of-home care who transition to a permanent placement through reunification, adoption or guardianship. Data are for all children who were in out-of-home placement during the Federal Fiscal Year. SIGNIFICANCE The uncertainty of multiple, prolonged or unstable out-of-home placements can negatively affect children’s emotional well-being, identity formation and sense of belonging, which have an impact on behavior, academic achievement, health and longterm self-sufficiency. 1,2,3 Particular attention must be paid to populations of children for whom permanency may be more difficult to achieve, including older children, males, children with disabilities and minority children. 4,5,6 Planning for permanency requires a mix of family-centered and legal strategies designed to ensure that children and youth have safe, stable and lifelong connections with caring adults. 7,8,9 One of the goals of the federal Fostering Connections to Success and Increasing Adoptions Act of 2008 is to promote permanency through relative or kinship guardianship and adoption. The Fostering Connections Act requires states to notify relatives when a child is placed in foster care, provides funding for states offering kinship guardianship assistance payments, provides incentive payments for adoptions of older children and children with special needs, and requires that states inform families considering adopting a foster child about the availability of the adoption tax credit. 10,11 Youth who age out of foster care experience high rates of economic hardship (inability to pay rent, utilities, etc.), low educational attainment, hunger, homelessness, unemployment, and poor physical and mental health. These youth are more likely to enter the criminal justice system, become teen parents and enroll in public assistance programs. 12 Child welfare agencies can develop systems that ensure that they are making progress in achieving youth outcomes in the areas of employment, education, housing, life skills, community connections, personal and cultural identity, physical and mental health, and access to legal information and documents, including medical and educational histories. 13 The Fostering Connections Act encourages states to extend foster care beyond age 18 by providing federal reimbursement for foster care, adoption, and guardianship assistance payments for youth up to the age of 21. 14,15 Exits from Foster Care*, <strong>Rhode</strong> <strong>Island</strong>, FFY 2009 ALL EXITS WITH DISABILITY OVER AGE 12 AT ENTRY Adoption 19% 23% 1% Guardianship 6% 2% 2% Reunification 60% 50% 70% Aged Out 10% NA** 16% Other 5% 24% 12% Total Number 1,493 470 628 Source: Safety, permanency, and well-being in <strong>Rhode</strong> <strong>Island</strong>: Child welfare outcomes annual report for FY 2009 (Draft). (2009). New Haven, CT: Prepared by the Consultation Center, Yale University School of Medicine for the Data Analytic Center of the <strong>Rhode</strong> <strong>Island</strong> Department of Children, Youth & Families. Percentages may not sum to 100% due to rounding. *Foster Care refers to all out-of-home placements, consistent with language used in federal reports. **Children with a disability who age out are included in the “other” category. ◆ In Federal Fiscal Year (FFY) 2009, 1,493 children in out-of-home placement in <strong>Rhode</strong> <strong>Island</strong> exited care. Of these, 85% exited to a permanent placement (adoption, guardianship or reunification). Children with disabilities were somewhat more likely than other children to exit to adoption and less likely to exit to reunification with their biological family. 16 ◆ In FFY 2009, 16% of children in <strong>Rhode</strong> <strong>Island</strong> who entered out-of-home placement reentered care within 12 months of a prior episode, the same as the rate in FFY 2005. <strong>Rhode</strong> <strong>Island</strong> children re-enter care at almost twice the rate of the national standard (8.6%). 17 Reunification ◆ The percentage of children in the <strong>Rhode</strong> <strong>Island</strong> child welfare system who were reunified with their family of origin in less than 12 months from the time of removal from the home decreased from 74% in FFY 2005 to 68% of children in FFY 2009. The national standard is 76% of reunifications occurring within 12 months of the child’s removal. 18 ◆ In FFY 2009, the vast majority (87%) of child maltreatment cases in <strong>Rhode</strong> <strong>Island</strong> involved neglect. 19 The greatest contributors to neglect are poverty, parental substance abuse and/or mental illness. Achieving timely and successful reunification requires access to substance abuse and mental health treatment, in-home services, parenting skills training, assistance in meeting basic needs, child care and specific strategies to decrease isolation and strengthen community supports. 20 108 <strong>2010</strong> <strong>Rhode</strong> <strong>Island</strong> KIDS COUNT <strong>Factbook</strong> / Safety
- Page 1 and 2:
2010 Rhode Island Kids Count Factbo
- Page 3 and 4:
Rhode Island KIDS COUNT Board of Di
- Page 5 and 6:
Overview From: I’ll Be You and Yo
- Page 7:
Family and Community From: On Freed
- Page 10 and 11:
Table 1. Child Population, Rhode Is
- Page 12 and 13:
Children in Single-Parent Families
- Page 14 and 15:
Table 3. Grandparents Caring for Gr
- Page 16 and 17:
Infants Born at Highest Risk Table
- Page 18 and 19:
Table 5. Births by Education Level
- Page 20 and 21:
Racial and Ethnic Diversity Table 6
- Page 22 and 23:
Racial and Ethnic Disparities Econo
- Page 24 and 25:
Racial and Ethnic Disparities Rhode
- Page 27 and 28:
600 Median Family Income DEFINITION
- Page 29 and 30:
Cost of Housing 1300 1200 1100 DEFI
- Page 31 and 32:
Homeless Children DEFINITION Homele
- Page 33 and 34:
Secure Parental Employment DEFINITI
- Page 35 and 36:
Children Receiving Child Support DE
- Page 37 and 38:
35 Children in Poverty DEFINITION C
- Page 39 and 40:
Children in Poverty Financial Asset
- Page 41 and 42:
2000 Children in Families Receiving
- Page 43 and 44:
Children in Families Receiving Cash
- Page 45 and 46:
Children Receiving SNAP Benefits 75
- Page 47 and 48:
Women and Children Participating in
- Page 49 and 50:
50 Children Participating in School
- Page 51:
Health Make Music with Your Life by
- Page 54 and 55:
Children’s Health Insurance Table
- Page 56 and 57:
010 90 80 70 60 50 40 30 20 Vaccina
- Page 58 and 59: Access to Dental Care Oral Health S
- Page 60 and 61: Children’s Mental Health Referenc
- Page 62 and 63: Children with Special Needs Medical
- Page 64 and 65: Table 17. Breastfeeding Rates, Rhod
- Page 66 and 67: Women with Delayed Prenatal Care Ta
- Page 68 and 69: Preterm Births Table 19. Preterm Bi
- Page 70 and 71: Table 20. Low Birthweight Infants,
- Page 72 and 73: Infant Mortality Table 21. Infant M
- Page 74 and 75: Table 22. Lead Poisoning in Childre
- Page 76 and 77: Table 23. Asthma Hospitalizations f
- Page 78 and 79: Housing and Health Key Principles o
- Page 80 and 81: 20 15 Childhood Obesity 10 20% 15%
- Page 82 and 83: Table 24. Births to Teens, Ages 15-
- Page 84 and 85: Alcohol, Drug and Cigarette Use by
- Page 87 and 88: 30 Child Deaths DEFINITION Child de
- Page 89 and 90: Youth Violence DEFINITION Youth vio
- Page 91 and 92: Disconnected Youth DEFINITION Disco
- Page 93 and 94: Juveniles Referred to Family Court
- Page 95 and 96: Juveniles at the Training School DE
- Page 97 and 98: Juveniles at the Training School Gi
- Page 99 and 100: Children of Incarcerated Parents DE
- Page 101 and 102: Children Witnessing Domestic Violen
- Page 103 and 104: Child Abuse and Neglect DEFINITION
- Page 105 and 106: Child Abuse and Neglect Indicated A
- Page 107: Children in Out-of-Home Placement D
- Page 111: Child of the Sun by Lillian M. Fish
- Page 114 and 115: Table 31. Rhode Island Public Schoo
- Page 116 and 117: Table 32. Infants and Toddlers Enro
- Page 118 and 119: Table 33. Children Ages Birth to Th
- Page 120 and 121: Infant and Preschool Child Care Tab
- Page 122 and 123: Table 35. Measuring Quality in Earl
- Page 124 and 125: Children Enrolled in Head Start Tab
- Page 126 and 127: Full-Day Kindergarten Table 37. Chi
- Page 128 and 129: Children Receiving Child Care Subsi
- Page 130 and 131: Federal Financing After-School Care
- Page 132 and 133: English Language Learners Table 40.
- Page 134 and 135: Table 41. Kindergarten Through 12th
- Page 136 and 137: Table 42. Student Mobility and Stab
- Page 138 and 139: Fourth-Grade Reading Skills Table 4
- Page 140 and 141: Eighth-Grade Reading Skills Table 4
- Page 142 and 143: Table 45. Fourth and Eighth Grade M
- Page 144 and 145: Schools Making Insufficient Progres
- Page 146 and 147: Chronic Early Absence Table 47. Chr
- Page 148 and 149: School Attendance Table 48. Student
- Page 150 and 151: Table 49. Disciplinary Actions, Rho
- Page 152 and 153: High School Graduation Rate Table 5
- Page 154 and 155: College Preparation and Access Tabl
- Page 156 and 157: Teens Not in School and Not Working
- Page 158 and 159:
Methodology The 2010 Rhode Island K
- Page 160 and 161:
Methodology & References Family Inc
- Page 162 and 163:
References 6 U.S. Census Bureau, Am
- Page 164 and 165:
References 13,15 Rhode Island Depar
- Page 166 and 167:
References (continued from page 63)
- Page 168 and 169:
References 15 U.S. Department of He
- Page 170 and 171:
References RICHIST, 2009. 29 Safety
- Page 172 and 173:
References 16,21 Chang, H. N. & Agu
- Page 174 and 175:
Rhode Island KIDS COUNT Committees
- Page 176 and 177:
Acknowledgements The 2010 Rhode Isl
- Page 178 and 179:
Acknowledgements Michael Burk, RI D
- Page 180:
Notes 180 2010 Rhode Island KIDS CO