2010 Rhode Island Kids Count Factbook
2010 Rhode Island Kids Count Factbook
2010 Rhode Island Kids Count Factbook
Create successful ePaper yourself
Turn your PDF publications into a flip-book with our unique Google optimized e-Paper software.
Children Enrolled in Special Education<br />
DEFINITION<br />
Children enrolled in special education<br />
is the percentage of K-12 students who<br />
received special education services in<br />
<strong>Rhode</strong> <strong>Island</strong> public schools or who<br />
were placed in private special education<br />
programs by their district of residence.<br />
Unless otherwise specified, references to<br />
students enrolled in special education in<br />
this indicator do not include preschool<br />
or parentally-placed special education<br />
students.<br />
SIGNIFICANCE<br />
Effective and appropriate special<br />
education and related services are<br />
important resources for improving longterm<br />
outcomes for children and youth<br />
with special needs. Students with<br />
disabilities are more likely than students<br />
without disabilities to have lower<br />
student achievement, graduation rates,<br />
participation in post-secondary<br />
education and economic success in<br />
adulthood. 1,2 Students with disabilities<br />
are more likely than their peers to<br />
report social and academic difficulties<br />
in school. 3<br />
The federal Individuals with<br />
Disabilities Education Act (IDEA) Part B<br />
mandates that local school districts<br />
identify and evaluate students ages three<br />
to 21 whom they have reason to believe<br />
have disabilities. Once found eligible<br />
for special education, a student must be<br />
provided with an Individualized<br />
Education Program (IEP) laying out<br />
goals and outlining steps for achieving<br />
the goals. Services described in the IEP<br />
must be provided to students in the<br />
least restrictive environment (to the<br />
extent appropriate, integrated into a<br />
regular-education setting). 4,5,6<br />
In the 2007-2008 school year, <strong>Rhode</strong><br />
<strong>Island</strong> had the highest percentage of<br />
public school students with IEPs in the<br />
U.S. at 20%, compared with 12%<br />
overall in the U.S. 7<br />
In <strong>Rhode</strong> <strong>Island</strong> in the 2008-2009<br />
school year, there were 24,302 (17%)<br />
students enrolled in special education.<br />
Forty-one percent of <strong>Rhode</strong> <strong>Island</strong><br />
children enrolled in special education<br />
had a learning disability, 17% had a<br />
health impairment, 16% had a speech<br />
impairment, 10% had an emotional<br />
disturbance, 6% had an autism spectrum<br />
disorder, 4% had mental retardation and<br />
5% had other disabilities. 8<br />
Thirty-seven percent of <strong>Rhode</strong> <strong>Island</strong><br />
special education students in 2008-2009<br />
were ages five to 10; 33% were ages 11<br />
to 14; 28% were ages 15 to 18; and 2%<br />
were ages 19 to 21. There were an<br />
additional 2,635 preschool students in<br />
<strong>Rhode</strong> <strong>Island</strong> receiving special education<br />
services during the 2008-2009 school<br />
year. Of these preschool children, 46%<br />
were receiving speech and language<br />
services, 40% had a developmental<br />
delay, 7% had an autism spectrum<br />
disorder, and 7% had other disabilities. 9<br />
132 <strong>2010</strong> <strong>Rhode</strong> <strong>Island</strong> KIDS COUNT <strong>Factbook</strong> / Education<br />
100%<br />
90%<br />
80%<br />
70%<br />
60%<br />
50%<br />
40%<br />
30%<br />
20%<br />
10%<br />
0%<br />
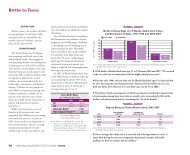
4th Grade Reading Proficiency Rates,<br />
by Special Education Status, <strong>Rhode</strong> <strong>Island</strong>, 2009<br />
Source: <strong>Rhode</strong> <strong>Island</strong> Department of Elementary and Secondary Education, New England Common Assessment Program<br />
(NECAP), October 2009. Percentages may not sum to 100% due to rounding.<br />
100<br />
90<br />
◆ In <strong>Rhode</strong> <strong>Island</strong>, students with disabilities achieve at lower levels than non-disabled<br />
80<br />
students 70 on the state assessments. In 2009, 48% of special education students in <strong>Rhode</strong><br />
60<br />
<strong>Island</strong><br />
50<br />
were substantially below proficient, compared with 8% of regular education<br />
students.<br />
40 10<br />
30<br />
20<br />
10<br />
◆ The federal No Child Left Behind Act (NCLB) requires states, districts and schools to<br />
0<br />
demonstrate that students with disabilities make “adequate yearly progress” towards<br />
proficiency in reading and math. Together with IDEA, NCLB promotes accountabilty for<br />
90<br />
the achievement of students with disabilities. 11 90<br />
80<br />
70<br />
◆ Nationally, students with disabilities are much less likely than their peers to graduate<br />
60<br />
60<br />
from high school and are five times less likely to go on to post-secondary education than<br />
50<br />
students without disabilities. 12 50<br />
The <strong>Rhode</strong> <strong>Island</strong> four-year graduation rate among<br />
40<br />
40<br />
students receiving special education services for the class of 2009 was 59%, compared to<br />
30<br />
the overall state graduation rate of 75%. 13 30<br />
20<br />
10<br />
◆ Of <strong>Rhode</strong> <strong>Island</strong> students ages six to 21 receiving special education services during the<br />
0<br />
0<br />
2008-2009 school year, 71% were in a regular class for 80% of the day or more, 7% were<br />
in a regular class for 40% to 79% of the day and 15% were in a regular class for less than<br />
90%<br />
90%<br />
40% of the day. The remaining students were in a residential or correction facility or<br />
80%<br />
were home-bound or hospitalized. 14<br />
80%<br />
85%<br />
84%<br />
84%<br />
81%<br />
70%<br />
60%<br />
50%<br />
40%<br />
30%<br />
20%<br />
Regular Education Students<br />
8%<br />
65%<br />
48%<br />
Substantially<br />
below Proficient<br />
57%<br />
78%<br />
18%<br />
48%<br />
Special Education Students<br />
Partially Proficient Proficient Proficient<br />
with Distinction<br />
73%<br />
80<br />
70<br />
20<br />
10<br />
70%<br />
60%<br />
50%<br />
40%<br />
30%<br />
20%<br />
54%<br />
27% 23% 21%<br />
68%<br />
66%<br />
65%<br />
2%


