2010 Rhode Island Kids Count Factbook
2010 Rhode Island Kids Count Factbook
2010 Rhode Island Kids Count Factbook

You also want an ePaper? Increase the reach of your titles
YUMPU automatically turns print PDFs into web optimized ePapers that Google loves.
Table 24.<br />
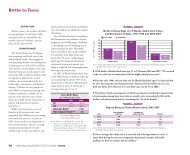
Births to Teens, Ages 15-19, <strong>Rhode</strong> <strong>Island</strong>, 2004-2008<br />
Births to Teens<br />
NUMBER OF BIRTH RATE PER NUMBER OF BIRTH RATE PER NUMBER OF BIRTH RATE PER<br />
BIRTHS TO GIRLS 1,000 GIRLS BIRTHS TO GIRLS 1,000 GIRLS BIRTHS TO GIRLS 1,000 GIRLS<br />
CITY/TOWN AGES 15-17 AGES 15-17 AGES 18-19 AGES 18-19 AGES 15-19 AGES 15-19<br />
Barrington 2 0.9 8 10.9 10 3.5<br />
Bristol 7 3.8 33 8.9 40 7.2<br />
Burrillville 5 2.8 24 22.9 29 10.2<br />
Central Falls 115 61.3 214 136.3 329 95.5<br />
Charlestown 4 6.0 14 NA 18 18.1<br />
Coventry 35 10.9 74 43.8 109 22.2<br />
Cranston 94 13.6 166 41.2 260 23.8<br />
Cumberland 17 5.4 51 34.9 68 14.8<br />
East Greenwich 4 2.8 5 10.0 9 4.7<br />
East Providence 50 11.0 121 52.5 171 24.9<br />
Exeter 4 5.5 4 NA 8 7.8<br />
Foster 2 NA 10 NA 12 17.9<br />
Glocester 6 5.2 22 37.0 28 16.1<br />
Hopkinton 8 9.2 16 NA 24 18.8<br />
Jamestown 0 0.0 2 NA 2 2.7<br />
Johnston 24 10.5 52 39.7 76 21.1<br />
Lincoln 10 4.6 34 36.2 44 14.1<br />
Little Compton 0 NA 8 NA 8 NA<br />
Middletown 13 9.5 34 50.0 47 22.9<br />
Narragansett 4 3.2 15 13.8 19 8.1<br />
New Shoreham 0 NA 0 NA 0 NA<br />
Newport 48 24.1 88 25.7 136 25.1<br />
North Kingstown 14 5.3 45 37.2 59 15.2<br />
North Providence 26 10.5 62 42.0 88 22.3<br />
North Smithfield 5 4.9 11 NA 16 10.8<br />
Pawtucket 227 33.3 440 96.9 667 58.7<br />
Portsmouth 6 3.6 15 24.8 21 9.2<br />
Providence 796 46.7 1,435 48.7 2,231 48.0<br />
Richmond 12 14.7 20 NA 32 28.8<br />
Scituate 3 2.5 8 15.5 11 6.4<br />
Smithfield 5 2.9 18 6.6 23 5.1<br />
South Kingstown 10 3.6 42 5.0 52 4.7<br />
Tiverton 5 3.7 20 27.4 25 12.0<br />
Warren 10 10.0 25 43.1 35 22.2<br />
Warwick 79 10.0 192 48.4 271 22.8<br />
West Greenwich 3 5.6 11 NA 14 16.8<br />
West Warwick 45 18.3 116 69.7 161 39.1<br />
Westerly 28 12.9 70 63.3 98 29.9<br />
Woonsocket 134 31.6 326 115.6 460 65.2<br />
Core Cities 1,365 39.6 2,619 60.2 3,984 51.1<br />
Remainder of State 495 7.7 1,232 27.9 1,727 15.9<br />
<strong>Rhode</strong> <strong>Island</strong> 1,860 18.9 3,851 44.0 5,711 30.7<br />
Source of Data for Table/Methodology<br />
<strong>Rhode</strong> <strong>Island</strong> Department of Health, Center for Health<br />
Data and Analysis, Maternal and Child Health<br />
Database, 2004-2008. Data for 2008 are<br />
provisional. The denominators are the number of<br />
girls in each age group according to Census 2000,<br />
multiplied by five to compute rates over five years.<br />
<strong>Factbook</strong>s published before 2007 reported only on births<br />
to girls ages 15 to 17. In recent years, the definition<br />
of teen childbearing has been expanded to include<br />
teens ages 18-19 because researchers are finding that<br />
babies born to slightly older teens do not have much<br />
better outcomes than those born to teens in younger<br />
age groups.<br />
Core cities are Central Falls, Newport, Pawtucket,<br />
Providence, West Warwick and Woonsocket.<br />
NA: Rates were not calculated for cities and towns with<br />
less than 100 teen girls in the age category, as rates<br />
with small denominators are statistically unreliable.<br />
References<br />
1,4,7<br />
Hoffman, S. D. (2006). By the numbers: The public<br />
costs of teen childbearing. Washington, DC: The<br />
National Campaign to Prevent Teen Pregnancy.<br />
2,10<br />
Martin, J. A., et al. (2009). Births: Final data for<br />
2006. National Vital Statistics Reports, 57(7).<br />
Hyattsville, MD: Centers for Disease Control and<br />
Prevention.<br />
3,5<br />
Klein, J. D. & The Committee on Adolescence.<br />
(2005). Adolescent pregnancy: Current trends and<br />
issues. Pediatrics, 116(1), 281-286.<br />
6<br />
Why it matters: Teen pregnancy and education. (2009).<br />
Washington, DC: National Campaign to Prevent<br />
Teen Pregnancy.<br />
8<br />
<strong>Rhode</strong> <strong>Island</strong> Department of Health, KIDS NET<br />
Database, 2009.<br />
9<br />
Perper, K. & Manlove, J. (2009). Estimated percentage<br />
of females who will become teen mothers: Differences<br />
across states. Washington, DC: Child Trends.<br />
11<br />
Hamilton, B. E., Martin, J. A. & Ventura, S. J.<br />
(2009). Births: Preliminary data for 2007. National<br />
Vital Statistics Reports, 57(12). Hyattsville, MD:<br />
Centers for Disease Control and Prevention.<br />
(continued on page 166)<br />
<strong>2010</strong> <strong>Rhode</strong> <strong>Island</strong> KIDS COUNT <strong>Factbook</strong> 81