2010 Rhode Island Kids Count Factbook
2010 Rhode Island Kids Count Factbook
2010 Rhode Island Kids Count Factbook

Create successful ePaper yourself
Turn your PDF publications into a flip-book with our unique Google optimized e-Paper software.
Racial and Ethnic Disparities<br />
<strong>Rhode</strong> <strong>Island</strong>’s Hispanic Children and Youth<br />
◆ In 2008, there were 43,821 Hispanic children under age 18 living in <strong>Rhode</strong> <strong>Island</strong>,<br />
up from 35,282 in 2000. Hispanic children made up 19% of <strong>Rhode</strong> <strong>Island</strong>’s child<br />
population in 2008, compared with 14% in 2000. 43<br />
◆ In 2000, more than three-quarters (78%) of the Hispanic children in <strong>Rhode</strong> <strong>Island</strong><br />
lived in Central Falls, Pawtucket, and Providence. 44 While Providence has the largest<br />
population of Hispanics overall, they are most densely concentrated in Central Falls. 45<br />
Economics<br />
◆ Thirty-six percent of <strong>Rhode</strong> <strong>Island</strong>’s Hispanic children were living in poverty in 2008,<br />
compared to the national rate of 28%. 46 The median family income for Hispanics in<br />
<strong>Rhode</strong> <strong>Island</strong> is $35,798, compared to $71,081 overall in <strong>Rhode</strong> <strong>Island</strong>. 47<br />
Health<br />
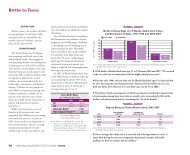
◆ In <strong>Rhode</strong> <strong>Island</strong> between 2004 and 2008, 19.1% percent of Hispanic babies were born<br />
to women who received delayed or no prenatal care, compared with 14.0% of all babies<br />
in the state. 48<br />
◆ Hispanic female teens between the ages of 15 and 19 in <strong>Rhode</strong> <strong>Island</strong> have a birth rate<br />
that is over three times higher than the overall teen birth rate in <strong>Rhode</strong> <strong>Island</strong> (101.7 per<br />
1,000 teens ages 15 to 19 compared to 30.9 per 1,000). 49,50<br />
Education<br />
◆ The Hispanic high school graduation rate for the class of 2009 was 64%, the lowest of<br />
any racial/ethnic group in the state and lower than the overall <strong>Rhode</strong> <strong>Island</strong> high school<br />
graduation rate of 75%. 51<br />
◆ Hispanic immigrants in <strong>Rhode</strong> <strong>Island</strong> are less likely to have a high school diploma but<br />
more likely to have a college degree or higher than U.S.-born Hispanics. 52<br />
References<br />
1,3<br />
U.S. Census Bureau, American Community Survey,<br />
2006-2008. Table S0901, Children Characteristics.<br />
2,5<br />
Acevedo-Garcia, D., McArdle, N., Osypuk, T. L.,<br />
Lefkowitz, B. & Krimgold, B. K. (2007). Children<br />
left behind: How metropolitan areas are failing<br />
America’s children. Cambridge, MA: Harvard School<br />
of Public Health & Center for the Advancement of<br />
Health.<br />
4,24<br />
U.S. Census Bureau, American Community Survey,<br />
2006-2008. Tables R1704, B17020A, B17020B,<br />
B17020C, B17020D & B170202I.<br />
6,44<br />
U.S. Census Bureau, Census 2000, Summary File 1.<br />
7<br />
Providence Plan analysis of U.S. Census Bureau, Census<br />
2000 data.<br />
8<br />
Mouw, T. & Entwisle, B. (2006). Residential<br />
segregation and interracial friendship in schools.<br />
American Journal of Sociology, 112(2), 394-441.<br />
9<br />
Iceland, J., Weinberg, D. H., & Steinmetz, E. (2002).<br />
Racial and ethnic residential segregation in the United<br />
States 1980 – 2000. Washington, DC: U.S. Census<br />
Bureau.<br />
10<br />
Weller, C. E. & Logan, A. (2009). Leveling the playing<br />
field: How to ensure minorities share equitably in the<br />
economic recovery and beyond. Washington, DC:<br />
Center for American Progress.<br />
11<br />
Reidenback, L. & Weller, C. (<strong>2010</strong>). The state of<br />
minorities in <strong>2010</strong>: Minorities are suffering<br />
disproportionately in the recession. Washington, DC:<br />
Center for American Progress.<br />
12<br />
Orfield, G. (2009). Reviving the goal of an integrated<br />
society: A 21st Century challenge. Los Angeles, CA:<br />
The Civil Rights Project/Proyecto Derechos Civiles<br />
at University of California Los Angeles.<br />
13<br />
Wells, A. S., et al. (2009). Boundary crossing for<br />
diversity, equity and achievement: Inter-district school<br />
desegregation and educational opportunity. Cambridge,<br />
MA: Charles Hamilton Houston Institute for Race<br />
and Justice.<br />
14<br />
Race matters: Unequal opportunities in education. (n.d.).<br />
Baltimore, MD: The Annie E. Casey Foundation.<br />
15<br />
Rueben, K. & Murray, S. (2008). Racial disparities in<br />
education finance: Going beyond equal revenues.<br />
Washington, DC: The Urban Institute.<br />
16,38<br />
<strong>Rhode</strong> <strong>Island</strong> Department of Elementary and<br />
Secondary Education, New England Common<br />
Assessment Program (NECAP), 2005-2009.<br />
17,21<br />
Fiscella, K. & Kitzman, H. (2009). Disparities in<br />
academic achievement and health: The intersection<br />
of child education and health policy. Pediatrics,<br />
123(3), 1073-1080.<br />
18<br />
Ready for college: Advocates series, action brief #1. (2006).<br />
Washington, DC: The Forum for Youth Investment.<br />
19<br />
The National Center for Public Policy and Higher<br />
Education. (n.d.). Measuring up 2008: <strong>Rhode</strong> <strong>Island</strong><br />
report card. Retrieved January 15, <strong>2010</strong> from<br />
www.highereducation.org<br />
20<br />
Engle, J. & Lynch, M. (2009). Charting a necessary<br />
path: The baseline report of public higher education<br />
systems in the Access to Success Initiative. Washington,<br />
DC: The Education Trust and the National<br />
Association of System heads.<br />
22<br />
Parsing the Achievement Gap II. (2009). Princeton, NJ:<br />
Educational Testing Service.<br />
23<br />
Rothstein, R. (2006). Reforms that could help narrow the<br />
achievement gap. San Francisco, CA: WestEd.<br />
25<br />
U.S. Census Bureau, American Community Survey,<br />
2006-2008. Tables B25003, B25003A, B25003B,<br />
B25003C, B25003D & B25003I.<br />
26<br />
U.S. Census Bureau, Census 2000, Tables P46,<br />
PCT70A, PCT70B, PCT70C, PCT70D &<br />
PCT70H.<br />
27<br />
Bridgeland, J. M., Dilulio, J. J., Jr. & Morison, K. B.<br />
(2006). The silent epidemic: Perspectives of high school<br />
dropouts. Washington, DC: Civic Enterprises, LLC.<br />
28,29<br />
<strong>Rhode</strong> <strong>Island</strong> Department of Health, Maternal and<br />
Child Health Database, 2004-2008. Data for 2008<br />
are provisional.<br />
30<br />
<strong>Rhode</strong> <strong>Island</strong> Department of Health, Hospital<br />
Discharge Database, 2004-2008.<br />
31<br />
Mead, H., Cartwright-Smith, L., Jones, K., Ramos, C.<br />
Woods, K. & Siegel, B. (2008). Racial and ethnic<br />
disparities in U.S. health care: A chartbook. New York,<br />
NY: The Commonwealth Fund.<br />
(continued on page 160)<br />
<strong>2010</strong> <strong>Rhode</strong> <strong>Island</strong> KIDS COUNT <strong>Factbook</strong> 23