2010 Rhode Island Kids Count Factbook
2010 Rhode Island Kids Count Factbook
2010 Rhode Island Kids Count Factbook

You also want an ePaper? Increase the reach of your titles
YUMPU automatically turns print PDFs into web optimized ePapers that Google loves.
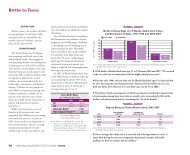
Children Enrolled in Head Start<br />
Table 36.<br />
Children Enrolled in Head Start, <strong>Rhode</strong> <strong>Island</strong>, 2009<br />
# OF ESTIMATED ESTIMATED # OF CHILDREN ESTIMATED % OF ELIGIBLE<br />
CHILDREN ELIGIBLE CHILDREN ELIGIBLE CHILDREN ENROLLED IN CHILDREN ENROLLED<br />
CITY/TOWN AGES 3 & 4 < 100% OF FPL * 100-129% OF FPL * HEAD START IN HEAD START<br />
Barrington 416 10 0 2 21%<br />
Bristol 547 54 9 35 56%<br />
Burrillville 370 35 14 21 43%<br />
Central Falls 607 260 82 98 29%<br />
Charlestown 184 7 17 8 32%<br />
Coventry 789 45 25 39 56%<br />
Cranston 1,689 143 43 206 100%<br />
Cumberland 776 32 32 3 5%<br />
East Greenwich 381 29 5 1 3%<br />
East Providence 1,030 134 46 107 59%<br />
Exeter 220 35 25 5 8%<br />
Foster 76 0 0 0 NA<br />
Glocester 313 18 2 2 10%<br />
Hopkinton 263 19 31 10 20%<br />
Jamestown 71 0 0 0 NA<br />
Johnston 638 55 20 57 76%<br />
Lincoln 483 24 7 8 25%<br />
Little Compton 66 3 0 4 100%<br />
Middletown 508 30 32 45 73%<br />
Narragansett 290 18 4 7 31%<br />
New Shoreham 27 1 0 2 100%<br />
Newport 599 223 41 118 45%<br />
North Kingstown 750 85 15 37 37%<br />
North Providence 540 60 35 51 54%<br />
North Smithfield 180 13 1 0 0%<br />
Pawtucket 2,112 643 136 184 24%<br />
Portsmouth 443 24 0 9 38%<br />
Providence 4,590 1,919 451 797 34%<br />
Richmond 226 7 4 5 48%<br />
Scituate 164 6 0 3 49%<br />
Smithfield 365 5 3 5 66%<br />
South Kingstown 660 33 0 23 69%<br />
Tiverton 261 12 2 15 100%<br />
Warren 243 17 15 25 79%<br />
Warwick 1,989 137 52 144 76%<br />
West Greenwich 241 11 5 3 19%<br />
West Warwick 791 207 59 113 42%<br />
Westerly 538 51 45 57 60%<br />
Woonsocket 1,233 443 94 206 38%<br />
Core Cities 9,932 3,695 863 1,516 33%<br />
Remainder of State 15,737 1,153 489 939 57%<br />
<strong>Rhode</strong> <strong>Island</strong> 25,669 4,848 1,352 2,455 40%<br />
Source of Data for Table/Methodology<br />
<strong>Rhode</strong> <strong>Island</strong> Head Start Programs, all children enrolled<br />
(ages three to five) as of October 2009. Children<br />
enrolled are listed by residence of child, not location<br />
of the Head Start program.<br />
The estimated number of children eligible for Head<br />
Start is divided into two categories (below 100% of<br />
the Federal Poverty Line and between 100 and<br />
129% of the Federal Poverty Line) as described in<br />
the income eligibility guidelines passed as part of<br />
the Improving Head Start for School Readiness Act of<br />
2007. The estimated number of Head Start eligible<br />
children is calculated by multiplying the number<br />
of three- and four-year-old children in each<br />
community from Census 2000, Summary File 3 by<br />
the percentage of children under age five living in<br />
families with incomes below 100% of the poverty<br />
level and between 100 and 129% of the poverty<br />
level in that community, according to Census 2000,<br />
Summary File 3.<br />
*This is an estimate of the income-eligible population<br />
and does not take into account other children who<br />
are eligible for Head Start services (e.g., children in<br />
homeless families) or changes in child population<br />
and poverty rates since 2000. Also, federal Head<br />
Start regulations allow 10% of enrolled children to<br />
be over the income threshold.<br />
Core cities are Central Falls, Newport, Pawtucket,<br />
Providence, West Warwick and Woonsocket.<br />
References<br />
1,4<br />
Currie, J. & Neidell, M. (2003). Getting inside the<br />
“black box” of Head Start quality: What matters and<br />
what doesn’t? (Working paper 10091). Cambridge,<br />
MA: National Bureau of Economic Research.<br />
2<br />
Head Start participants, programs, families, and staff in<br />
2006. (2008). Washington, DC: Center for Law<br />
and Social Policy.<br />
3<br />
Klein, L. & Knitzer, J. (2007). Promoting effective early<br />
learning: What every policymaker and educator should<br />
know. New York: National Center for Children in<br />
Poverty, Columbia University.<br />
5<br />
Head Start impact study: First year findings (Executive<br />
Summary). (2005). Washington, DC: U.S.<br />
Department of Health and Human Services,<br />
Administration for Children and Families.<br />
(continued on page 170)<br />
<strong>2010</strong> <strong>Rhode</strong> <strong>Island</strong> KIDS COUNT <strong>Factbook</strong> 123