2010 Rhode Island Kids Count Factbook
2010 Rhode Island Kids Count Factbook
2010 Rhode Island Kids Count Factbook

Create successful ePaper yourself
Turn your PDF publications into a flip-book with our unique Google optimized e-Paper software.
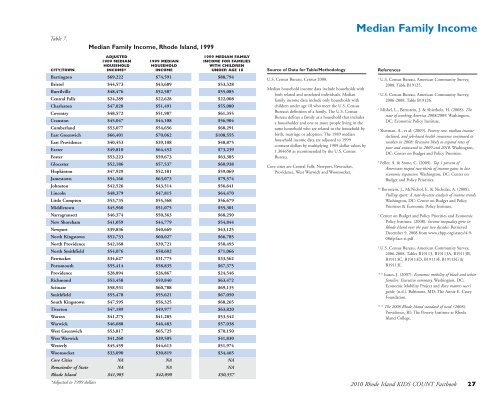
Table 7.<br />
Median Family Income, <strong>Rhode</strong> <strong>Island</strong>, 1999<br />
Median Family Income<br />
ADJUSTED<br />
1999 MEDIAN FAMILY<br />
1989 MEDIAN 1999 MEDIAN INCOME FOR FAMILIES<br />
HOUSEHOLD HOUSEHOLD WITH CHILDREN<br />
CITY/TOWN INCOME* INCOME UNDER AGE 18<br />
Barrington $69,222 $74,591 $88,794<br />
Bristol $44,573 $43,689 $53,328<br />
Burrilville $48,476 $52,587 $55,085<br />
Central Falls $24,289 $22,628 $22,008<br />
Charleston $47,020 $51,491 $55,080<br />
Coventry $48,572 $51,987 $61,355<br />
Cranston $45,047 $44,108 $56,904<br />
Cumberland $53,077 $54,656 $68,291<br />
East Greenwich $66,401 $70,062 $108,555<br />
East Providence $40,453 $39,108 $48,875<br />
Exeter $49,810 $64,452 $73,239<br />
Foster $53,223 $59,673 $63,385<br />
Glocester $52,186 $57,537 $60,938<br />
Hopkinton $47,929 $52,181 $59,069<br />
Jamestown $54,166 $63,073 $79,574<br />
Johnston $42,526 $43,514 $56,641<br />
Lincoln $48,379 $47,815 $64,470<br />
Little Compton $53,735 $55,368 $56,679<br />
Middletown $45,960 $51,075 $55,301<br />
Narragransett $46,374 $50,363 $68,250<br />
New Shoreham $41,059 $44,779 $54,844<br />
Newport $39,836 $40,669 $43,125<br />
North Kingstown $52,733 $60,027 $66,785<br />
North Providence $42,168 $39,721 $50,493<br />
North Smithfield $54,076 $58,602 $71,066<br />
Pawtucket $34,627 $31,775 $33,562<br />
Portsmouth $55,414 $58,835 $67,375<br />
Providence $28,894 $26,867 $24,546<br />
Richmond $53,458 $59,840 $63,472<br />
Scituate $58,931 $60,788 $69,135<br />
Smithfield $55,478 $55,621 $67,050<br />
South Kingstown $47,595 $56,325 $68,265<br />
Tiverton $47,189 $49,977 $63,820<br />
Warren $41,275 $41,285 $53,542<br />
Warwick $46,688 $46,483 $57,038<br />
West Greenwich $53,817 $65,725 $70,150<br />
West Warwick $41,260 $39,505 $41,830<br />
Westerly $45,459 $44,613 $51,974<br />
Woonsocket $33,090 $30,819 $34,465<br />
Core Cities NA NA NA<br />
Remainder of State NA NA NA<br />
<strong>Rhode</strong> <strong>Island</strong> $41,985 $42,090 $50,557<br />
*Adjusted to 1999 dollars<br />
Source of Data for Table/Methodology<br />
U.S. Census Bureau, Census 2000.<br />
Median household income data include households with<br />
both related and unrelated individuals. Median<br />
family income data include only households with<br />
children under age 18 who meet the U.S. Census<br />
Bureau’s definition of a family. The U.S. Census<br />
Bureau defines a family as a household that includes<br />
a householder and one or more people living in the<br />
same household who are related to the household by<br />
birth, marriage or adoption. The 1989 median<br />
household income data are adjusted to 1999<br />
constant dollars by multiplying 1989 dollar values by<br />
1.304650 as recommended by the U.S. Census<br />
Bureau.<br />
Core cities are Central Falls, Newport, Pawtucket,<br />
Providence, West Warwick and Woonsocket.<br />
References<br />
1<br />
U.S. Census Bureau, American Community Survey,<br />
2008. Table B19125.<br />
2<br />
U.S. Census Bureau, American Community Survey,<br />
2006-2008. Table B19126.<br />
3<br />
Mishel, L., Bernstein, J. & Shierholz, H. (2008). The<br />
state of working America 2008/2009. Washington,<br />
DC: Economic Policy Institute.<br />
4<br />
Sherman, A., et al. (2009). Poverty rose, median income<br />
declined, and job-based health insurance continued to<br />
weaken in 2008: Recession likely to expand rates of<br />
poor and uninsured in 2009 and <strong>2010</strong>. Washington,<br />
DC: Center on Budget and Policy Priorities.<br />
5<br />
Feller, A. & Stone, C. (2009). Top 1 percent of<br />
Americans reaped two-thirds of income gains in last<br />
economic expansion. Washington, DC: Center on<br />
Budget and Policy Priorities.<br />
6,8<br />
Bernstein, J., McNichol, E. & Nicholas, A. (2008).<br />
Pulling apart: A state-by-state analysis of income trends.<br />
Washington, DC: Center on Budget and Policy<br />
Priorities & Economic Policy Institute.<br />
7<br />
Center on Budget and Policy Priorities and Economic<br />
Policy Institute. (2008). Income inequality grew in<br />
<strong>Rhode</strong> <strong>Island</strong> over the past two decades. Retrieved<br />
December 9, 2008 from www.cbpp.org/states/4-9-<br />
08sfp-fact-ri.pdf<br />
9<br />
U.S. Census Bureau, American Community Survey,<br />
2006-2008. Tables B19113, B19113A, B19113B,<br />
B19113C, B19113D, B19113F, B19113G &<br />
B19113I.<br />
10,11<br />
Isaacs, J. (2007). Economic mobility of black and white<br />
families: Executive summary. Washington, DC:<br />
Economic Mobility Project and Race matters user’s<br />
guide. (n.d.). Baltimore, MD: The Annie E. Casey<br />
Foundation.<br />
12,13<br />
The 2008 <strong>Rhode</strong> <strong>Island</strong> standard of need. (2008).<br />
Providence, RI: The Poverty Institute at <strong>Rhode</strong><br />
<strong>Island</strong> College.<br />
<strong>2010</strong> <strong>Rhode</strong> <strong>Island</strong> KIDS COUNT <strong>Factbook</strong> 27