2010 Rhode Island Kids Count Factbook
2010 Rhode Island Kids Count Factbook
2010 Rhode Island Kids Count Factbook

You also want an ePaper? Increase the reach of your titles
YUMPU automatically turns print PDFs into web optimized ePapers that Google loves.
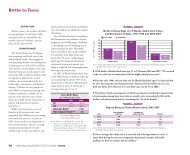
Table 5.<br />
Births by Education Level of Mother, <strong>Rhode</strong> <strong>Island</strong>, 2004-2008<br />
BACHELOR’S DEGREE<br />
LESS THAN<br />
OR ABOVE SOME COLLEGE HIGH SCHOOL DIPLOMA HIGH SCHOOL DIPLOMA<br />
CITY/TOWN TOTAL # OF BIRTHS N % N % N % N %<br />
Barrington 667 521 78% 63 9% 61 9% 7 1%<br />
Bristol 921 458 50% 184 20% 203 22% 46 5%<br />
Burrillville 754 282 37% 178 24% 219 29% 51 7%<br />
Central Falls 2,021 170 8% 230 11% 782 39% 731 36%<br />
Charlestown 370 199 54% 68 18% 75 20% 23 6%<br />
Coventry 1,683 755 45% 353 21% 431 26% 114 7%<br />
Cranston 4,325 1,936 45% 764 18% 1,125 26% 376 9%<br />
Cumberland 1,784 1,017 57% 310 17% 342 19% 72 4%<br />
East Greenwich 517 385 74% 52 10% 50 10% 13 3%<br />
East Providence 2,606 960 37% 525 20% 744 29% 283 11%<br />
Exeter 261 134 51% 44 17% 56 21% 17 7%<br />
Foster 233 112 48% 37 16% 64 27% 14 6%<br />
Glocester 398 205 52% 70 18% 93 23% 19 5%<br />
Hopkinton 458 196 43% 88 19% 128 28% 35 8%<br />
Jamestown 187 148 79% 18 10% 13 7% 2 1%<br />
Johnston 1,390 567 41% 272 20% 420 30% 104 7%<br />
Lincoln 909 466 51% 176 19% 187 21% 46 5%<br />
Little Compton 141 89 63% 24 17% 25 18% 2 1%<br />
Middletown 984 467 47% 194 20% 260 26% 40 4%<br />
Narragansett 492 287 58% 89 18% 75 15% 21 4%<br />
New Shoreham 49 22 45% 18 37% 8 16% 0 0%<br />
Newport 1,516 672 44% 209 14% 329 22% 221 15%<br />
North Kingstown 1,272 730 57% 192 15% 247 19% 67 5%<br />
North Providence 1,615 680 42% 332 21% 438 27% 100 6%<br />
North Smithfield 439 252 57% 77 18% 74 17% 27 6%<br />
Pawtucket 5,668 1,271 22% 987 17% 1,960 35% 1,189 21%<br />
Portsmouth 810 487 60% 133 16% 146 18% 23 3%<br />
Providence 14,774 3,123 21% 1,836 12% 4,661 32% 4,432 30%<br />
Richmond 460 249 54% 72 16% 95 21% 35 8%<br />
Scituate 417 226 54% 86 21% 83 20% 13 3%<br />
Smithfield 730 435 60% 128 18% 119 16% 27 4%<br />
South Kingstown 1,161 726 63% 158 14% 191 16% 55 5%<br />
Tiverton 625 308 49% 145 23% 126 20% 35 6%<br />
Warren 527 214 41% 103 20% 144 27% 55 10%<br />
Warwick 4,193 1,901 45% 768 18% 1,053 25% 348 8%<br />
West Greenwich 245 123 50% 58 24% 50 20% 10 4%<br />
West Warwick 1,989 608 31% 340 17% 701 35% 287 14%<br />
Westerly 1,340 517 39% 267 20% 418 31% 122 9%<br />
Woonsocket 3,304 476 14% 559 17% 1,312 40% 836 25%<br />
Unknown 5 1 NA 2 NA 1 NA 0 NA<br />
Core Cities 29,272 6,320 22% 4,161 14% 9,745 33% 7,696 26%<br />
Remainder of State 32,963 16,054 49% 6,046 18% 7,763 24% 2,202 7%<br />
<strong>Rhode</strong> <strong>Island</strong> 62,240 22,375 36% 10,209 16% 17,509 28% 9,898 16%<br />
Mother’s Education Level<br />
Source of Data for Table/Methodology<br />
<strong>Rhode</strong> <strong>Island</strong> Department of Health, Center for Health<br />
Data and Analysis, 2004-2008. Data for 2008 are<br />
provisional. Data are self-reported and reported by<br />
the mother’s place of residence, not the place of the<br />
infant’s birth.<br />
Percentages may not sum to 100% for all cities, towns<br />
and the state because the number and percentage of<br />
births with unknown maternal education levels are<br />
not included in this table. Between 2004 and 2008,<br />
maternal education levels were unknown for 2,249<br />
births (4%).<br />
Core cities are Central Falls, Newport, Pawtucket,<br />
Providence, West Warwick and Woonsocket.<br />
References<br />
1,3<br />
Robert Wood Johnston Foundation, Education<br />
Matters for Health. Issue brief 6: Education and<br />
health. (2009). Retrieved January 19, <strong>2010</strong> from<br />
www.commissionhealth.org<br />
2<br />
Nichols, A. & Favreault, M. (2009). A detailed picture<br />
of intergenerational transmission of human capital.<br />
Washington, DC: Pew Charitable Trusts.<br />
4,7<br />
National Center for Children in Poverty. (2007).<br />
Parents’ low education leads to low income, despite fulltime<br />
employment. Retrieved January 19, <strong>2010</strong> from<br />
www.nccp.org<br />
5<br />
National Center for Children in Poverty. (2006). The<br />
racial gap in parental education. Retrieved January<br />
19, <strong>2010</strong> from www.nccp.org<br />
6<br />
Federal Interagency Forum on Child and Family<br />
Statistics. (2009). America’s children: Key national<br />
indicators of well-being, 2009. Retrieved January 19,<br />
<strong>2010</strong> from www.childstats.gov/americaschildren/<br />
8<br />
U.S. Census Bureau, American Community Survey,<br />
2006-2008. Table B20004.<br />
9,10,11<br />
<strong>Rhode</strong> <strong>Island</strong> Department of Health, Center for<br />
Health Data and Analysis, 2004-2008. Data for<br />
2008 are provisional.<br />
12<br />
U.S. Census Bureau, American Community Survey,<br />
2006-2008. Table S1702.<br />
<strong>2010</strong> <strong>Rhode</strong> <strong>Island</strong> KIDS COUNT <strong>Factbook</strong> 17